By Michael Wuetherick, P.Eng. User Group Leader: Red Deer Alberta August 11, 2015
Enhance your results by adding some gold…meaning add the GOLDEN ratio and Fibonacci retracements to your analysis!
The mysteries of the natural world have fascinated humans throughout history, science and innovation constantly strives to find the logical explanation of every phenomenon in the natural universe. Just like the physical world, the stock markets appear random and unpredictable and seemingly impossible for investors to understand. What do the size of galaxies, shells, tree rings, number of petals in a flower, the shape of the pyramids….and yes the stock market have in common? Simple, the Golden Ratio!!
Each of these natural systems share natural geometric phenomenon described by Leonard Pisano Bogolla, an Italian mathematician knows as “Fibonacci” who first published his theory in his book Liber Abaca published in 1202. The Fibonacci (“Fib”) sequence is 0, 1, 1, 2, 3, 5, 8, 13, 21, 54…etc. The series starts with 0 and 1, and is derived by adding together the sum of the previous two numbers in the series increasing to infinity.
The Golden Ratio is calculated by dividing a number from the Fib series by the previous number, this number approaches 1.618 as the Fib number increases and is called the Golden Ratio! The inverse of the golden ratio is 0.618, which is also equal to the ratio of any Fib number divided by the next highest number. The key Fibonacci ratios are 23.6%, 38.2%, 61.8%, and the Golden ratio they share in common…1.618.
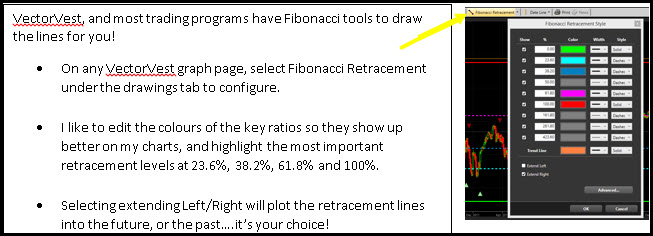
How can we use Fibonacci retracements to improve our technical analysis?
By now you no doubt are asking, what does this have to do with trading stocks? Often the broad markets, and many liquid stocks will tend to pause and occasionally reverse at 23.6%, 38.2%, 61.8% and 100% of recent trading ranges.
Fibonacci retracements are one of the most powerful LEADING technical indicators of future market action. For example, this chart is for the SPY ETF which tracks the S&P 500 broad market index. To draw the retracement, start at the most recent significant low (Feb. 2, 2105) and end with the most recent high recorded on May 20th, 2015.
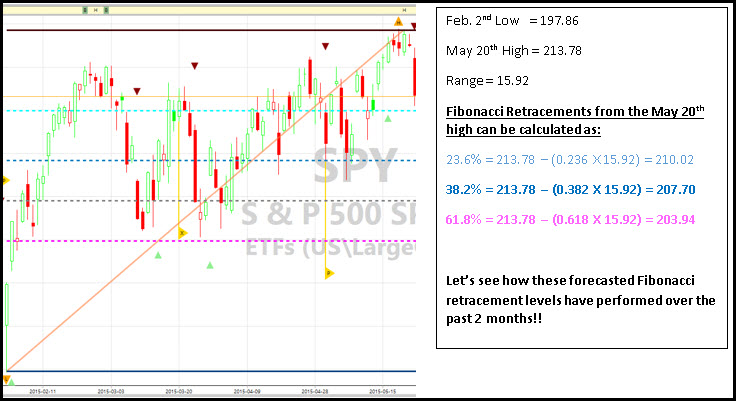
Why did I select this range? Well the VectorVest guidance turned decidedly negative around May 20th with both a Primary Wave down and DEW down signal coming on May 23rd along with guidance for prudent investors to move to the sidelines. By combining the market guidance, and Fibonacci retracements I was able to forecast where to look for support/resistance levels going forward.
Here is the same Fibonacci chart, only updated to August 11th, 2015. Note the 5 key trend reversals that occurred at on very close to the Fibonacci retracements drawn weeks early….how cool is that!!
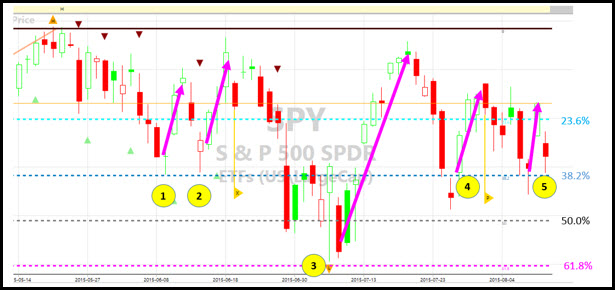
By combining the Fibonacci retracements and the appearance of strong reversal pattern candlesticks, you can increase the probability of playing the rally. Let’s analyze how to do this with five examples from above.
- June 9th – Doji candlestick with the tail trading to a low of 207.69, essentially spot on with the 38.2% Fibonacci retracement suggesting likely low point support. Buy the SPY on June 10th open at 209.37 and ride the short 2-3 day rally up!
- June 15th – SPY gapped down at the open and hit a low of 207.79, again right at the 38.2% retracement level before rebounding to close at 209.10 indicating a bullish “window open” bullish candlestick. Buy the SPY near the close on June 15th or at the open on June 16th and ride the 4 day rally up!
- July 7th – after a lengthy 10 day decline with high volatility, the SPY gaps up but immediately reverses on negative news out of Greece reversing the bullish open. The SPY aggressively sells off but starts to reverse of the low of 204.1, essentially spot on with the 61.8% Fibonacci retracement of 203.94. Are you starting to be a believer yet?!? SPY rebounds and closes near it the high for the day of 207.5 rallying 1.7% from the low of the day.
- July 28th – the market gaps up completing a morning star bullish reversal pattern formed from the previous two days price pattern. The star portion of the pattern on July 27th reached a high of 207.55, just below the 38.2% Fibonacci retracement of 207.69. The set-up was there to by the SPY if the market opened above 207.69, which it did the next day and continued to rally for the next 4-5 days.
- August 11th – following a huge market day fueled by potential delays in US Fed rate hikes, the market completely reverses all of the gains after China announces its deflating their currency. The market gaps down and trades aggressively down with the SPY hitting a low of 207.76…you guessed it right at the 38.2% Fibonacci replacement level! While not a strong rebound
Since the onset of quantitative easing, investors have benefitted from the relative “ease” of following trends and relying on more commonly used technical indicators to help in managing positions. However with the sideways, and often highly volatile markets we have been in for all of 2015 these methods don’t work as well. Fibonacci retracements are an excellent tool for analyzing price action over any time period (i.e. minutes, days, week, months). Knowing where these points are can hopefully avoid irrational emotional decisions, or worse listening to the business media personalities!
Try to avoid putting your stop losses just above Fibonacci levels as you increase the probability of the market tripping your stop and them immediately heading back up. Has anyone ever experienced that!?! Alternatively, set your stops just below key retracement levels as if the market blows through a retracement it has a much higher chance of falling to the next level. Don’t abandon your preferred stop technique, but when you get the alert to sell take a quick look to see what Fibonacci has to say before pulling the trigger!
YOUR COMMENTS PLEASE:
Michael Wuetherick, P.Eng. Red Deer User Group Leader, VectorVest Canada August 11, 2015


Thanks for that great explanation of this concept!
You are welcome Dorothy….I hope you can now apply the tool yourself to whatever stock or index you are interested in. Keep in mind however that Fib retracements are most applicable to large index and highly liquid stocks.
An update as August 12th opening, the close on August 11th touched the 38.2% retracement level before closing slightly higher suggesting possible support. However with the gap down this morning we now know that the bears are in control for now, the next levels to watch are 205.3 (50% retracement) and 203.6 (61.8% retracement). Combined with the SPY crossing below its 200 d SMA for only the 4-5 time in 5 years the US market is looking weak.
If the SPY crosses below 203.5 we very well could be in store for a move as low as 198 for the SPY which would mark a 9% pullback/correction from the high set in mid-March. Follow the VectorVest guidance “Prudent investors should move to the sidelines”
Exceptional Post thank you not only for the explanation of how to use but also how we can profit from this info. Thx
Thanks Michael:
An interesting application and example of applied Fibonacci ratios. Time for a little analysis of some recent trades!
Hi Michael,
A great introduction for me into the world of Fibonacci – How about you and Stan put together a live webinar on just this subject – That would be even more amazing
Nice to hear form you and Cheers !
Hi Barry, great to hear from you!! I was skeptical myself on this topic until I learned how to actually use them!! I am game for a guest webinar appearance if Stan is! It really is much easier to understand by doing live examples. Gibson are a misunderstood tool that every quanta rice trading computer trading system relies on extensively for decisions …that is why they work so well!
Thank you for a very for a very clear and useful explanation. Applied today and it worked. TY
Good job Renee!! It is uncanny but yet again today the SPY traded to a low 27.35 at 207.35 at roughly 11:54 am EST on August 19th. This is the 9th time since April that the SPY has reversed immediately upon touching the 38.2% Fib retracement level.
Trade Opportunity explained:
I waited for confirmation which came in the next candlestick and bought 200 shares of UPRO at 67.72 which is a short-term 3X leveraged ETF tracking the S&P500. I sold it 69.60 around 2:15 when the first bearish candle was printed following the Fed announcement. A quick 2.8% gain and a profit of $376 in a little over 3 hrs. I put in my stop-loss just below the intraday low at $67.15 so my maximum risk on the trade was $114 or 0.8% of my risked capital on that trade.
I hope this helps illustrate to you budding day traders how to use Fibonacci to help keep you occupied while waiting for a breakout so your buy-and-hold stocks start going up again!!
Good luck to all!
The wicked wedge has failed, the coil has sprung…..whatever term you want to use the markets are clearly in sell-off mood the past few days. When I prepared the Fib retracement piece I didn’t think I would need to comment on anything below the 61.8% stop at 203.6 on the SPY. For those of you still in the market the next Fib level, the 100% to the Feb.15 low is at 1979.6. Be careful!