

THE MARKET IN REVIEW
Rising Coronavirus cases spooked investors in the first trading session of the week and the TSX finished in negative territory. However, rallying gold shares helped the TSX reverse course and close to the upside Tuesday. Technology shares provided support mid-week and Canadian stocks closed higher again. The upward drive continued Thursday as gold shares showed their strength. Canada’s man index closed slightly lower Friday as tech losses weighed. After the TSX closed to the upside in three of five trading sessions, Canadian equities finished the week with an overall win.
THE NEW CDRS
Written by: Stan Heller
Last week, CIBC expanded its lineup of Canadian Depositary Receipts (CDRs) despite a challenging market that has virtually crushed the performance of most of its 30 initial offerings.
The 30 CDR tickers accessible for trading on the Canadian NEO Exchange include universally known companies like Tesla, Amazon, Apple, Home Depot and more. No one could argue that all 30 symbols are not world-class companies worthy of consideration for any investor’s portfolio. Still, most have struggled mightily in 2022, just like almost every other stock not in the petroleum business.
From December 31, 2021 to November 28, 2022, on the big board in New York, Tesla (TSLA) is down 48.07%, Amazon (AMZN) 43.65%, Home Depot (HD) 23.15%, and Apple (AAPL) 18.78%. Their Canadian CDRs have fared a little worse to a lesser or greater degree due to some currency slippage, CIBC’s management fees and other factors. The TSLA CDR, for example, is down 49.00% this year, a 0.93 percentage point differential, while AMZN CDR is down 44.72%, a 1.07 percentage points differential.
The five new CDRs now trading on NEO, and their ticker symbols, are:
* Abbvie Inc CDR – ABBV
* CVS Health CDR – CVS
* Honeywell CDR – HON
* Procter & Gamble CDR – PG
* UPS CDR – UPS
CDRs offer investors affordable access to these global equities while reducing the currency risk inherent in international investments. They are offered at a fraction of the underlying reference share’s price per share and trade in Canadian dollars. AAPL, for example, trades around $140.00 USD on the NASDAQ and around $22.00 CAD on the NEO. If you want to own 100 shares of AAPL, it’s a lot easier and less stressful to put out around $2,200 for 100 Canadian shares at $22.00 a share than buying 100 shares on the US exchange and forking out around $19,000 Canadian dollars.
So, if you wanted to open a basket of CDRs or add to your holdings with one of the new CDRs, which one would you choose? There isn’t much data in our VectorVest Canada database just yet since they were just added, so you would open the Stock Viewer in your US software and do a symbol search on ABBV, CVS, HON, PG and UPS. Copied below are a few key indicators you will see.

With a VST of 1.12, Honeywell has the best combination of Value, Safety and Timing as of November 28, 2022. The technical indicator, RT and the ‘B’ or Buy rating shows HON is currently in the most substantial uptrend, but its fundamentals of RV and RS are not as good as ABBV and UPS. Next, you should study the graphs. Our founder Dr. Bart DiLiddo says the graph is like the DNA of the company. I like to look at a five-year Weekly Graph with just the Price and EPS.
Now my choice is clearer. PG has the smoothest price pattern of the five stocks, and its earnings are good, although they have trailed off somewhat since July this year. ABBV has the smoothest price pattern since January 2021, but its EPS has been falling throughout 2022. My surprise choice is UPS. While its 5-year Price pattern isn’t the smoothest, the Price has risen steadily since June 2020 after the Covid collapse, pulling back only recently. Its earnings are the most consistent and have risen steadily since April 2021. The setup and market conditions aren’t where they need to be, but based on my analysis, UPS is at the top of my WatchList of these FIVE NEW CDRs.

VALUATION
The TSX Composite rose $101.89 per share to close the week at $20,485.66 per share. The VV-TSX rose $76.07 per share to $17,343.16 per share. It is now 15.34 % below the TSX Composite and is saying the TSX is overvalued. The Price of the VVC/CA rose $0.32 per share to end the week at $25.44 per share. The Value of the VVC/CA rose $0.18 per share to $23.05 per share. It is now 9.39 % below the VVC/CA Price and is saying the market is fully valued.

SUMMARY: With two green lights and one yellow light, the Color Guard is somewhat Bullish. With the Price of the VVC/CA moving higher on a week-to-week basis and the MTI above 1.00, we have an UpUp situation.
Click here for more analysis.
| Date | VVC-Price | VVC-RT | % Buys | % Sells | BS Ratio | CG-Price | CG-RT | CG-BSR | MTI | Trend |
| 12/02/2022 | 25.44 | 0.99 | 27.00 | 26.20 | 1.03 | G | Y | G | 1.26 | UpUp |
| 12/01/2022 | 25.43 | 0.98 | 26.50 | 26.80 | 0.99 | G | Y | Y | 1.24 | UpUp |
| 11/30/2022 | 25.28 | 0.97 | 24.50 | 26.70 | 0.92 | G | Y | Y | 1.19 | UpUp |
| 11/29/2022 | 25.04 | 0.95 | 21.50 | 28.50 | 0.76 | G | Y | Y | 1.14 | UpUp |
| 11/28/2022 | 24.96 | 0.93 | 20.70 | 30.80 | 0.67 | Y | Y | Y | 1.14 | UpUp |
| 11/25/2022 | 25.12 | 0.96 | 23.90 | 28.60 | 0.83 | G | Y | Y | 1.18 | UpUp |
| 11/24/2022 | 25.09 | 0.96 | 23.40 | 27.80 | 0.84 | G | Y | Y | 1.16 | UpUp |
| 11/23/2022 | 25.02 | 0.95 | 22.70 | 28.10 | 0.81 | G | Y | Y | 1.12 | UpUp |
| 11/22/2022 | 24.90 | 0.95 | 21.00 | 28.00 | 0.75 | G | Y | Y | 1.07 | UpUp |
| 11/21/2022 | 24.71 | 0.91 | 16.50 | 31.70 | 0.52 | G | R | Y | 1.01 | UpUp |
| 11/18/2022 | 24.67 | 0.92 | 16.90 | 30.90 | 0.55 | Y | Y | Y | 1.00 | DnDn |
| 11/17/2022 | 24.59 | 0.92 | 15.30 | 30.80 | 0.50 | Y | Y | Y | 0.99 | UnDn |
| 11/16/2022 | 24.69 | 0.93 | 16.10 | 29.60 | 0.54 | Y | Y | Y | 1.01 | UpUp |
| 11/15/2022 | 24.71 | 0.94 | 18.10 | 28.40 | 0.64 | G | Y | Y | 1.02 | C/Up |
| 11/14/2022 | 24.63 | 0.93 | 14.80 | 30.90 | 0.48 | Y | Y | Y | 1.00 | UpUp |
STRATEGY
The Price of the VVC/CA managed to move higher for the second consecutive week as rising gold shares provided support. Overall, it gained $0.32 per share over the last five trading days to close at $25.44 per share. Furthermore, all three of our key Market Timing indicators, the RT, BSR and MTI, also moved higher this week. Nevertheless, geopolitical, inflation and interest rate concerns continue to surround the market, so let’s take things one day at a time.
With two green lights and an UpUp situation:
- Prudent Investors may buy stocks long if the market is rising.
- Aggressive Investors and Traders should play the market with a bias to the upside.
Today’s Derby Winners, having ten-stock portfolios, the five Searches with the highest 1-Day percent price gains are:
| Search | Total % Gain | |
| Marijuana Stocks | 6.17 % | |
| Marijuana Magic | 4.43 % | |
| Show Me The Money Long/CA | 2.69 % | |
| Thornton’s Thunder | 2.60 % | |
| Angel’s Wings | 2.46 % | |
Today’s 5-Day Derby Winners, having ten-stock portfolios, the five Searches with the highest percent price gains over the last five trading days are:
| Search | Total % Gain | |
| Marijuana Stocks | 11.93 % | |
| Thornton’s Thunder | 8.82 % | |
| Marijuana Magic | 8.71 % | |
| Gold Digger | 8.08 % | |
| Finding Firework Stocks | 7.46 % | |
PORTFOLIOS
Model Portfolio #1 Aggressive: We are long with selections from the “Ballistic New Highs – RS” search which is located in the Searches – Long Term Winners group in the UniSearch tool. We will be using a 50% Gain or 10% Loss to exit our long positions.
Model Portfolio #2 Conservative: We are long with selections from the “Pale Blue Chips – RS” search which is located in the Searches – Long Term Winners group in the UniSearch tool. We will be using a 50% Gain or 20% Loss to exit our long positions.
Model Portfolio #3 Retirement: We are long with selections from the “High CI Rising Dividends” search which is located in the Searches – Retirement group in the UniSearch tool. We will be using a Rec=”S” to exit our long positions.
Model Portfolio #4 Conservative: We are long with selections from the “Steady Eddies” search which is located in the Searches – Conservative group in the UniSearch tool. We will be using a Rec=”S” to exit our long positions.
Model Portfolio #5 Prudent: We are long with selections from the “Safe and Sound” search which is located in the Searches – Prudent group in the UniSearch tool. We will be using a VST < 1.20 to exit our long positions.
All investors should be aware of the risks involved in implementing aggressive strategies. They should not assume that future results will be profitable or will equal representations of past performance; real, indicated or implied. VectorVest, Inc., its employees or affiliates are not responsible for any losses you may incur.
SPECIAL PRESENTATION
KEEP YOUR EYE ON THE MTI
Investors are currently being flooded with information centered around earnings, inflation, and interest rates. As a result of all this activity, many investors are having a hard time determining what to do in the stock market. Is the market trending? Is the market topping or bottoming? Join Mr. Glenn E. Tompkins Jr., Senior Instructor, as he demonstrates how our Market Timing Indicator (MTI) has helped thousands of investors navigate turbulent market conditions. In order to make money and preserve profits, all you have to do is “Keep Your Eye on the MTI.”
To see this fantastic presentation, please CLICK HERE.
P.S. We will be holding a live webcast on Tuesday, December 6th at 12:30 PM ET where we will host a Q&A session related to this strategy presentation. To register for this webcast CLICK HERE. Space is limited.
CLIMATE
Real Gross Domestic Product rose 0.1% from the previous month in September, while on an annualized basis it rose 0.7% quarter-over-quarter and 3.9% year-over-year in the third quarter. The Markit Manufacturing Purchasing Managers Index rose 0.8 index points to 49.6 in November. The Current Account Balance fell to a deficit of $11.1 billion in the third quarter. Labour Productivity rose 0.6% in the third quarter. The Labour Force Survey reported that Employment rose by 10,100 in November, while Unemployment fell 0.1 percentage point to 5.1% and the Participation Rate fell 0.1% to 64.8%. Average Hourly Earnings rose 5.4% on an annual basis in November.
CURRENT MARKET SCENARIO
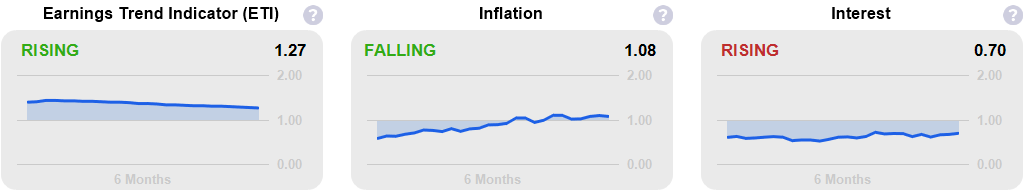
Case 3 Rarely Happens
Our Composite of Investment Climate Indicators (shown here) remained unchanged at a level of 1.13. The major mover last week was the T-Notes, whose indicator rose 0.09 points. Our forecast of TSX Earnings rose $0.01 to $3.76. Its indicator fell 0.01 point to a level of 1.27. We currently have a Case 3, Bull market scenario in which earnings and interest rates are rising, while inflation is falling. (See VectorVest Views of 03/21/03, 03/28/03, 10/24/03, 09/29/06 and 10/13/06 for more information on various Bull and Bear market scenarios.)
VectorVest Investment Climate Indicators: (0-2 Scale, Values Above 1.00 are Favorable)
The Truth Chart
| Case | Earnings | Inflation | Interest | Comments | |
|---|---|---|---|---|---|
| Case 1 | Rising | Rising | Falling | Bull Market Begins | |
| Case 2 | Rising | Falling | Falling | Bull Market Thrives | |
| Case 3 | Rising | Falling | Rising | Rarely Happens | |
| Case 4 | Rising | Rising | Rising | Bull Market Ends | |
| Case 5 | Falling | Rising | Rising | Bear Market Begins | |
| Case 6 | Falling | Falling | Rising | Rarely Happens | |
| Case 7 | Falling | Falling | Falling | Bear Market Prevails | |
| Case 8 | Falling | Rising | Falling | Bear Market Ends | |
TOP STOCK OF THE WEEK
SDE, Spartan Delta Corp. is an energy company that engages in the exploration, development and production of petroleum and natural gas properties in western Canada. Annual sales increased 136% over the last 12 months to $1.3 billion. Leading 12-month forecasted earnings are $2.91 per share. Earnings are forecasted to grow at 43% per year. This stock closed today at $15.51 per share, up $0.97 per share for the week. We think it is currently worth $18.83 per share. With an excellent combination of upside potential and financial performance, this stock is suitable for Prudent Investors. There are 155.8 million shares outstanding and its ticker symbol is SDE on the Toronto Stock Exchange. You may call +1 (403) 265-8011 for more information.


Leave A Comment