After Fed minutes showed that a Sept. rate hike is still on the table, markets on both sides of the border rallied off session lows but couldn’t hold on, finishing sharply in the red. In Canada, the TSX fell 157 points or 1.11% and is now down more than 4.0% YTD. Petroleum, Banks and Transports led the TSX lower. On the U.S. markets, decliners outnumbered advancers by nearly 3 to 1.
For the weekly CA Color Guard Report, CLICK HERE FOR VIDEO REPORT .

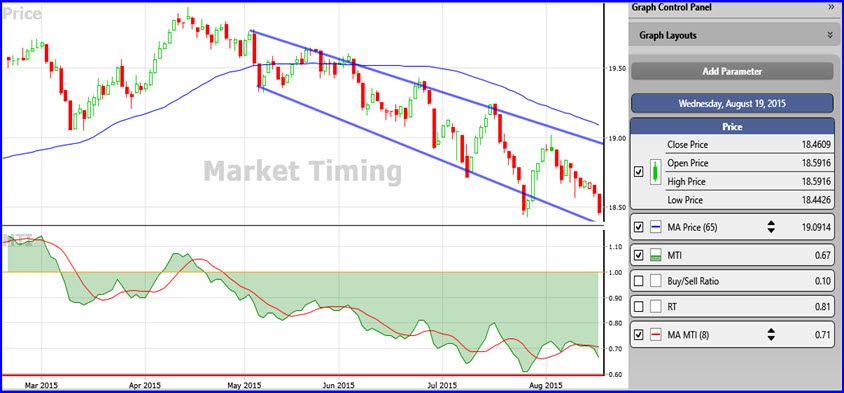
The broad Canadian market as shown by the Market Index graph below, continues to trend lower in a fairly narrow trading channel. After rising from a near historical bottom of 0.61 on July 28, the MTI peaked at 0.73 on Aug 5 and has fallen steadily lower to its current 0.67 level. VectorVest guidance is to remain on the sidelines at least until we get a Primary Wave Up (PW/Up) with follow-through. More conservative investors may wait until we have a Green Light in the price column for confirmation that a possible sustained uptrend is underway.
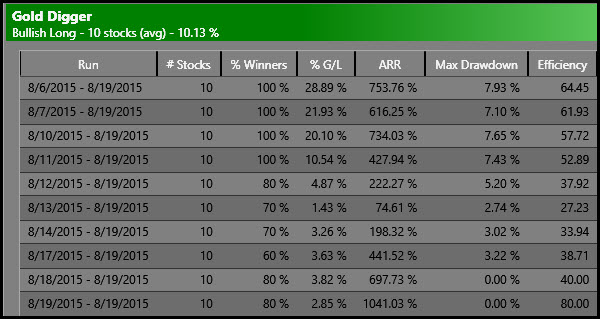
 Finally, there is one industry group that deserves our attention right now. The Gold/Silver industry group has risen about almost 14% over the last 10 ten days. The average price of all the stocks in the group is now above its 40-day MA. While we would like a little more confirmation with the 40-MA at least flattening out and then turning up, our Gold Digger search is already outperforming all searches over the last 10 days, including all the bearish or shorting searches. Historically we often see explosive gains from these stocks when price moves above the 40-MA of the average industry price. The graph below shows that over the last 10 days, no matter which day you ran the Gold Digger search, you would have ended the day with a positive gain. This feature of the Derby is simply called, Vary The Start Date.
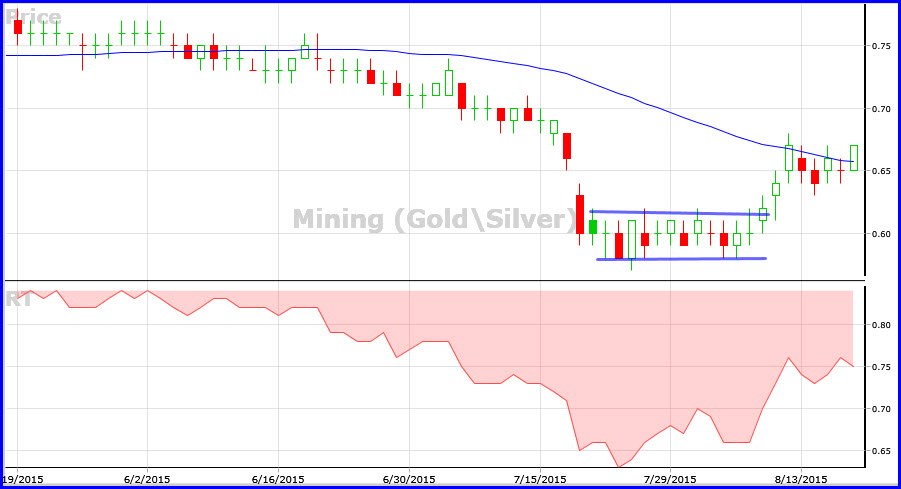
Below is the Gold/Silver industry graph with a 40-day MA. Of the Top 10 Gold Digger stocks from 10 trading days ago (Aug 5), IMG is the top gainer at 43%; EDR 42%; FR 36%, AGI 32% and YRI 30%.
DISCLAIMER: The information contained in this Blog is for education and information purposes only. Example trades should not be considered as recommendations. There are risks involved in investing and only you know your financial situation, risk tolerance, financial goals and time horizon.
Presented by Stan Heller, Consultant, VectorVest Canada

Leave A Comment