STRATEGY OF THE WEEK: “UNLEASHING THE POWER OF GRAPHS.”
The old saying, “A Picture is Worth A Thousand Words.” holds true when investing. Learning to read graphs is an important aspect of trading. VectorVest graphs are beautifully displayed and easy to use. In this week’s special presentation, Ms. Cathy O’Nan, Manager of Internal Training, explained and demonstrated the many features of our VectorVest Graphing tool; along with techniques to get you all the information you need before buying or selling stocks.
Please join me tomorrow Monday, August 10th at 12:30 PM ET where we will host our weekly CA SOTW Q&A session related to this strategy presentation. To register for this webcast CLICK HERE.
HERE’S AN IMPORTANT GRAPH – ONE WE’LL STUDY IN OUR WEBINAR TOMORROW.
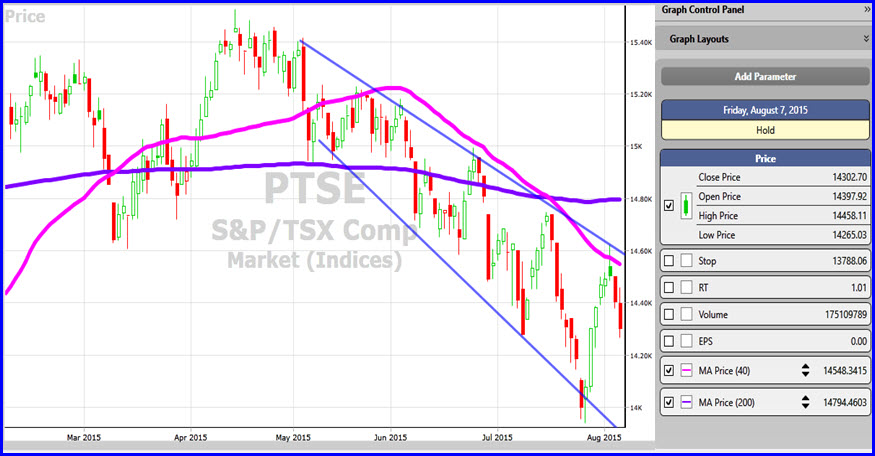
Notice how the TSX Composite (PTSE) last week couldn’t break resistance at the top of a long channel, suffering losses Thursday and Friday that wiped out a week’s worth of gains. The channel is shown by two trendlines (blue) and the upper channel is following the 40-day MA (pink line). The purple line is the 200-day MA and the TSX is well below that benchmark. VectorVest guidance for Prudent investors the last two weeks with the PW/Up has been urging caution when making any new purchases. Thursday and Friday our guidance changed to a stronger warning, ‘Prudent investors should move to the sidelines’, which means don’t buy any stocks long and strictly enforce your sell rules for any stocks you still own. While we might expect a bounce on the U.S. market next week (see below), it doesn’t look as promising for Canada as we have some distance to fall to the Support line at the bottom of the channel.
WHAT ABOUT THAT U.S. MARKET? Well, Dr. DiLiddo shared his views in two essays on Friday. Both would be worth your time to go back and read. The first one, titled “A Wolf In Sheep’s Clothing, offered a longer term view of the market in which he compared market conditions and the actions of the Federal Reserve on interest rates in 1987, 2007 and currently. He said a 1-year graph of the S&P 500 Volatility Index, the VIX, shows that the VIX is still quite low, so many investors think this means that it’s still OK to buy stocks….. “But don’t believe it. Yellen (Fed Reserve Chair Janet Yellen) shouldn’t even be talking about raising interest rates at this time, and a low VIX in this market is like A Wolf in Sheep’s Clothing.”
Still, Could We Get A Bounce Next Week? Dr. DiLiddo seems to think so. His second essay titled, Candlesticks Made Easy, was a study of the recent market action using candlesticks and our Market Timing graph. His conclusion: “Note that today’s red body is much shorter than yesterday’s red body. This signals that the downturn is petering out. In fact, the short red body atop the long wick is a bullish Hammer pattern. That’s Candlesticks Made Easy.
A look at the DIA, SPY, QQQ and RUT all show a hammer pattern from Friday’s trading. The QQQ was a hammer, but any bounce on this index could be tempered by resistance immediately overhead.
As you can see, we’ve got a lot to cover tomorrow. I hope you can join us for our live presentation CLICK HERE but if not, be sure to register to receive an email with a link to the recording.
DISCLAIMER: The information contained in this Blog is for education and information purposes only. Example trades should not be considered as recommendations. There are risks involved in investing and only you know your financial situation, risk tolerance, financial goals and time horizon.
Presented by Stan Heller, Consultant, VectorVest Canada


Hello Stan,
When a stock is removed from the TSX index because it was taken over by another company, as an example, is the stock removed from Vector Vests data base as if the stock never existed? Or is it removed from the date is was delisted forward?
If removed as if it never existed won’t back tests become unreliable? Won’t they be skewed because the stock in question will not being available for analysis during a timeframe in which it in fact existed?
For example: I build searches hoping to capture reliable/somewhat consistent patterns over several market conditions – I do this by back testing each calendar year over the last 8 years.
Will the results be skewed because stocks that existed in a particular calendar year are no longer available for search analysis because VV has removed them its database, even though they existed during the time frame of the back test?
Please confirm if this is correct, hoping it’s not – if it is, how should I proceed to ensure consistent historical back tests results regardless of when I run them.
I’ve a hundred or more back test spanning several timeframes that I reference often. These have been built over the las 18 months or so, if I run the exact same test now as I ran a year ago (over the same timeframe using the same search….) it seems to return different results. If this is the case I have more than several back tests that have been rendered unreliable.
Thank you,
Dan Keeley
Hi Dan, VectorVest’s practice is to remove a stock from the database once it has been removed from the TSX or Venture indices. This can skew your backtests, especially those that run over a long period. Always good practice to confirm lengthy backtests by running several tests and varying the start dates over shorter periods. Not perfect, but it does reduce some false results.