Good News! The Video Link for Saturday’s International User Group Online Forum is now available. Just Click Here To View the Recording!
Why look for Hidden Divergence Patterns? Technical analysis expert and author Dr. Barbara Star gave us several good reasons during her outstanding presentation to Saturday’s Online Forum. Dr. Star showed chart example after chart example how using a systematic method for spotting these divergences can lead to more wins and consistent profits in whatever timeframe you like to trade.
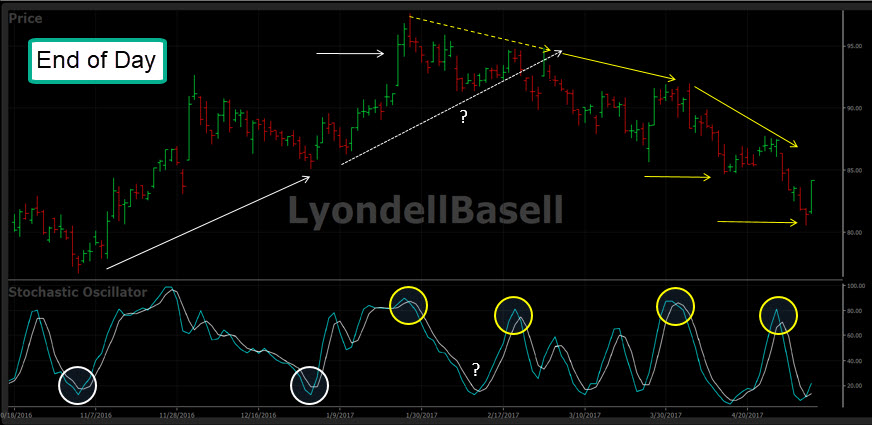
“Hidden Divergences give the investor a better idea when to be in a trade and when you should be exiting”, Dr. Star explained. What the Hidden Divergence Pattern is telling you, is there is a strong potential for a resumption or continuation of an uptrend after a pullback, whereas if you buy every pullback in the market, even on good stocks, you are going to lose money, she said.
You will also be able to preserve more profit on your winners and avoid staying in stocks that are more likely continue in a downtrend. “If you’re going to exit a trade, I think it’s much better to exit on strength when price is moving up than to wait until it drops below support, because you will be able to preserve much more profit that way.”
Along the way we learned effective set-ups for the Stochastics indicator and how to use the Fibonnaci retracement tool for finding realistic potential price targets. Interesting to note Dr. Star uses the 9%K and 3%D on Stochastics to better identify overbought and oversold extremes. Dr. Star also created a terrific new search to help investors spot potential Hidden Divergence Patterns early in development. As a technical search, the ProTrader premium plug-in is required. You can get a free 2-week trial of ProTrader and save $100 off the regular $495 USD price by call our Support team or clicking on this link: ProTrader Trial and Savings.
Dr. Star showed the LyondellBasell (LYB) chart below as a good example of all scenarios, when to enter a trade long, when to take profits, and when to enter a trade short or play an option trade to the downside.
What people were saying about Dr. Star’s presentation:
“Wonderful, clear, concise and usable.” – Audrey K.
“Dr. Star expresses her topic in both a clear and succinct manner. Love her presentation style.” – Graham M.
“Excellent explanation and set-up of the Fibonacci (retracement) – Margaret B.
“Another outstanding and useful tool to maximize profit and avoid losses! – Kamel C.
“The tool box is getting bigger. Many thanks.” – Michel G.
Heed the Color Guard, but some things to watch out for. Our Forum Market Review showed VectorVest’s global markets continue to show gains YTD outside of South Africa which is in a small loss position. Canada slipped into a Confirmed Down (C/Dn) condition Wednesday but recovered a bit of ground Thursday and Friday resulting in new, short-term Primary Wave Up signals. Despite a shrinking US dollar, resource stocks are having trouble getting traction which is hurting Canada’s overall market. The US remains resilient following a stellar earnings season but check the futures before you buy and don’t get careless. While our VectorVest indicators suggest more upside potential early next week, the VIX is at all-time low support zones. Considered a leading indicator, if the VIX bounces off of support that means the S&P 500 could pull back. From a MarketWatch article in the News section on our VectorVest Homepage: Stock Market Bracing for Potentially the Most Explosive Stretch of Trading This Year. Watch out for a trio of potentially destabilizing events on deck next Thursday, June 8. Former FBI director James Comey’s testimony, the UK election and the ECB monetary-policy meeting. Click Here To Read the Full Article.
Tuesday’s SOTW Q&A Webinar. We are pleased to let you know Dr. Star will join us for the first part of Tuesday’s June 6 Q&A Webinar. We will try to answer any follow-up questions from Saturday’s Forum before moving on to answering your questions about Friday’s excellent Special Presentation video which was all about, 3 Steps to Developing A Winning Portfolio. The webinar goes for an hour starting at 12:30 pm Eastern / 9:30 am Pacific. If you haven’t already done so, please register now to attend the live event or receive a link to the replay. Register Here.
To View previous Online Forum video replays, click on the recording links below:


Leave A Comment