

Last Friday’s essay in the US VectorVest Views was interesting. Titled Growth or Value, the writer set out to determine which of the two types of stocks have performed better since the March 23rd market low.
Investopedia defines Growth stocks as those that have the potential to outperform the overall market over time because of their future potential, while Value stocks are those that are currently trading below what they are really worth and will, therefore, provide a superior return.
For this study, applying what they have learned about the VectorVest system, the writer stated, “When I think of Growth vs. Value, I don’t think of traditional definitions, I immediately think of Earnings Growth (GRT) vs. Relative Value (RV).
“VectorVest’s GRT reflects a company’s one to three year forecasted earnings growth rate in percent per year. GRT is an indicator of a company’s health and future prospects. RV is an indicator of long-term price appreciation potential and is cast on a scale of 0.00 – 2.00. RV makes it possible to compare all stocks on a relational basis, with values above 1.00 having favorable price appreciation potential and values below 1.00 having unfavorable price appreciation potential, or as we say, they are selling at a premium. Both GRT and RV are forward-looking indicators. That’s important because the stock market looks to the future, not the past.”
So which is better, Growth or Value stocks? Here is how the tests were run in the US study. The writer opened the Stock Viewer and sorted by GRT for Growth Stocks and RV for Value Stocks. Quicktests of the top 10 stocks were run to June 18th using four primary VectorVest market timing signal dates after March 23rd as the start date. Using the four timing indicators was a smart way to vary the start dates and ensure some differences in the baskets of stocks being tested.
In this study, Value won with an average 113.4% return over the four periods, more than double the return of Growth stocks, which averaged 46.0%. Try it for yourself!
SO THE QUESTION BECAME, WHAT ABOUT CANADA? The results were a little different. Value stocks still outperformed Growth by a wide margin, 32.5% to 22.5%, but while most traders and investors would be happy with gains like that in just three months, they paled in comparison to the US study.
So I wondered, is there any way to boost those returns? Well, since we are measuring off a bottom, why not use the most effective bottom-fishing tool on the planet, VectorVest’s exclusive Relative Timing or RT indicator? RT analyzes the direction, magnitude, and dynamics of a stock’s price movements day-over-day, week-over-week, quarter-over-quarter and year-over-year. It is an extraordinarily fast and smart indicator.
When RT is rising above 1.0, the price trend is up, and it is a good time to buy. When RT falls below 1.0, the uptrend has dissipated. When you are bottom-fishing, you want to find stocks where price is not just low, but the trend is so battered, it almost can’t go any lower. At that point, it is likely to rebound and explode upward.
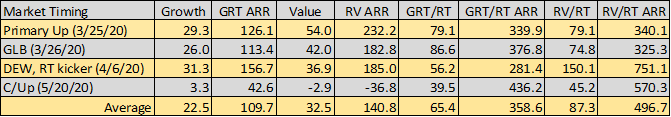
So, for my study, I went to the Stock Viewer and did the GRT and RV Sorts, but then I also sorted by GRT/RT and RV/RT. This combination finds stocks that have acceptable GRT and RV but low RT scores. When the market rebounds, these stocks should rebound faster and higher than others. As I expected, results with the bottom-fishing sorts were dramatically better. Value stocks still beat Growth. The Value combination RV/RT averaged 87.3% over the four periods, far better than the 32.5% by Value on its own. The Growth stocks GRT/RT averaged 65.4%, up from 22.5% when just sorting by Growth. Copied below is the table. I used the Quicktest end date of June 18th to be consistent with the US study:
Click or tap image to isolate
Be aware, this is a small study, looking at just one market bottom during a period when bottom-fishing strategies are known to have dominated the Derby 1-day and 5-day winners. That isn’t always the case. However, when you see such a trend, you should exploit it.
When you have VectorVest, you can not only remove the guesswork to determine which is best, GROWTH OR VALUE, but now you know how to add THE POWER OF RT.


hello,
I could not agree less. In my opinion in order to correctly apply the RV a customized watchlist is needed, a watchlist composed only by pure value names, suchs as the members of the S&P 500 Pure Value Index (etf tracking it is RPV). If, indeed, the SPYV is used the problem is that, in this case, there are names which show either in the SPYV or in the SPYG. Lastly based on my tests (either selecting the relevant ETFs or based on stock picking) the growth names outperform the value names with a better return with a better DD.
Hi Salvatore……thanks for your comments. Your idea to use a WatchList of good quality stocks to use in testing (and real trading) is useful guidance. Also appreciate your including the ETFs that others may find valuable. Thanks again.
Thanks for your kind reply Stan, however I still believe that the way the test was done is not right and the result, therefore, can casuse some problem.
Salva