

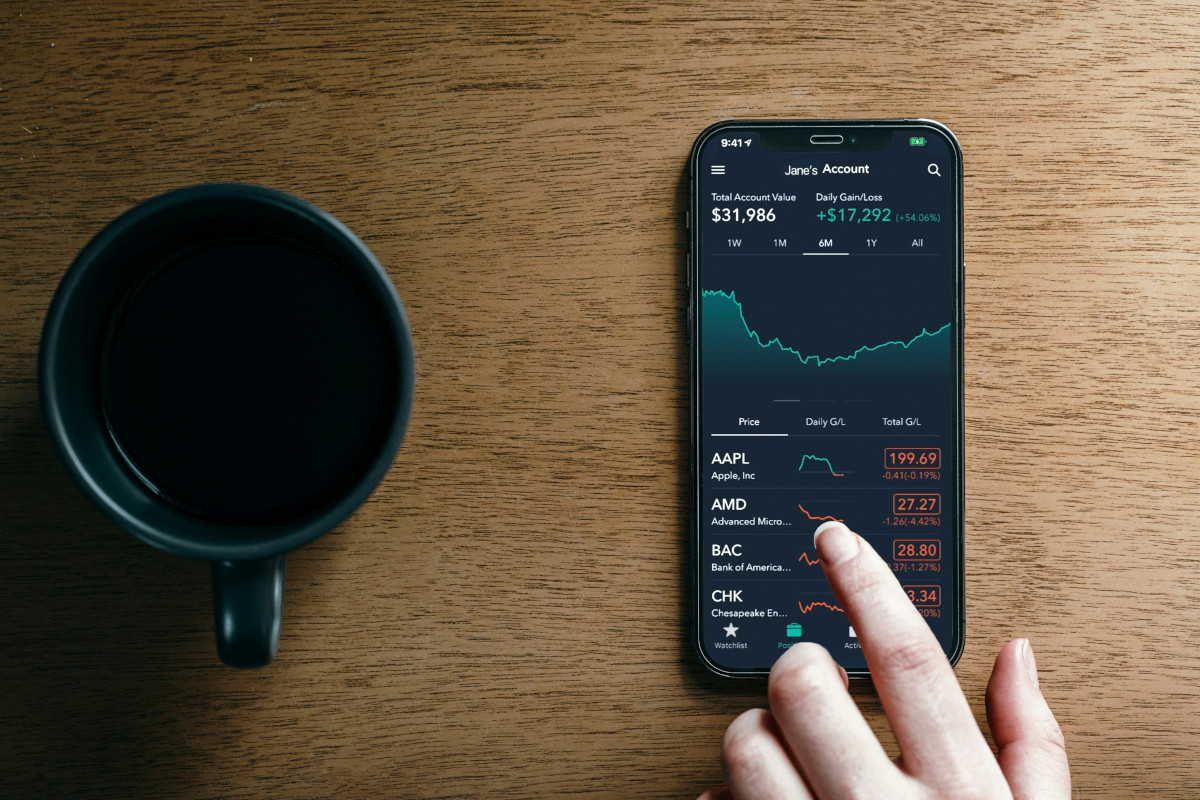
We were treated to two highly effective yet quite different searches and trading systems during our International Online User Group Forum Saturday, July 7. One is more aggressive, finding small cap stocks suited to a swing trading investment style and the other is more conservative, finding mid-caps to large cap ‘blue chips’ for the long-term investor.
Swing Trade Strategy
Keynote speaker George Clark delivered a terrific review of the step-by-step methods, analysis and strategy behind his Pensacola User Group Leader Portfolio Competition-leading entry. The trading system, which George described as a “swing trading” strategy, uses Show Me the Money Long for the long search and Hindenburg Stocks for shorting.
While George said you can expect volatility with this trading system, backtesting results of 823% since 2012 and 374% since 2016 proved its robustness over the long term in different market conditions. Pensacola’s trading system is currently in first place in the User Group Leader Portfolio Competition with a gain of 23.54% in just six weeks. George’s Forum presentation was aimed at helping VectorVest subscribers prepare for the September All Subscriber Competition, and it did just that in spades.
Prudent Strategy
In our second presentation, Stan Heller, Consultant for VectorVest Canada, showed a conservative strategy taken from the guidance in Dr. DiLiddo’s little green book of Stocks, Strategies and Common Sense. It was created from the section where Dr. DiLiddo writes, “Here’s how to make good money in stocks with low risk.” Not surprisingly, it’s a strategy and trading system that finds outstanding companies with consistent and predictable earnings that are rising in price. Despite its conservative investment style, the trading system delivered a 40% ARR in Canada and 25% in the US over a six year, seven month backtest, not including dividends.
Revealing more wisdom from Dr. DiLiddo’s little green book, Stan quoted a section about graphs. Dr. DiLiddo writes, “I especially like to see a stock flat-line; then breakout on high volume… Don’t underestimate the importance of high volume. It reflects the conviction of buyers who are driving the stock’s price higher and higher. You have to recognize that they probably know something you don’t.”
Below is an example of a flat-line pattern just before CFX broke out on high volume.

Click or tap image to enlarge.
CLICK HERE TO VIEW THE REPLAY:
https://attendee.gotowebinar.com/recording/6560887429938904583
You don’t want to miss viewing this video. Here’s just a small sampling of the comments chatted in during the live event:
“Excellent, clear professional presentation. Well Done!! Thanks George for sharing your many hours spent in backtesting. Another gem.” — Gord N.
“Great presentations from both George and Stan. Very informative and can be enacted right away.” — Michel G.
“Great presentation to alert us not to forget the basics, and keep it real.” — Mark R.
Upcoming Fixed Income ETFs Webinar. There was considerable interest in our upcoming exclusive, free webinar presented by Mark Noble, Senior Vice President and head of Sales Strategy with Horizons ETFs. The date is Thursday, July 12 at 12:00 pm ET. As always, register in advance to get the recording even if you can’t attend the live event.
Here is the registration link:
http://news.vectorvest.com/CA_FixedIncomeETFs_071218_registrationR.html
Thanks again everyone for your support of the International Online User Group Forum. Your participation with questions and comments makes it a valuable and worthwhile experience for everyone. Our thanks to Manny Faial from our VectorVest Support Team for answering many of your questions behind the scenes.
Wishing you Safe Investing.


Leave A Comment