
Support and Resistance breakouts can be some of the best trades you make, no matter if you are a day trader, swing trader or long-term investor. When done correctly, with the wind at your back with market timing and good fundamentals, they can get you into the money very quickly after entering the trade. This allows you to use a tight stop-loss for a better reward to risk ratio.
We had a terrific discussion about Support and Resistance during Tuesday’s SOTW Q&A. During a chart review, we found that Support and Resistance is a pattern that works well with either daily or weekly graphs.
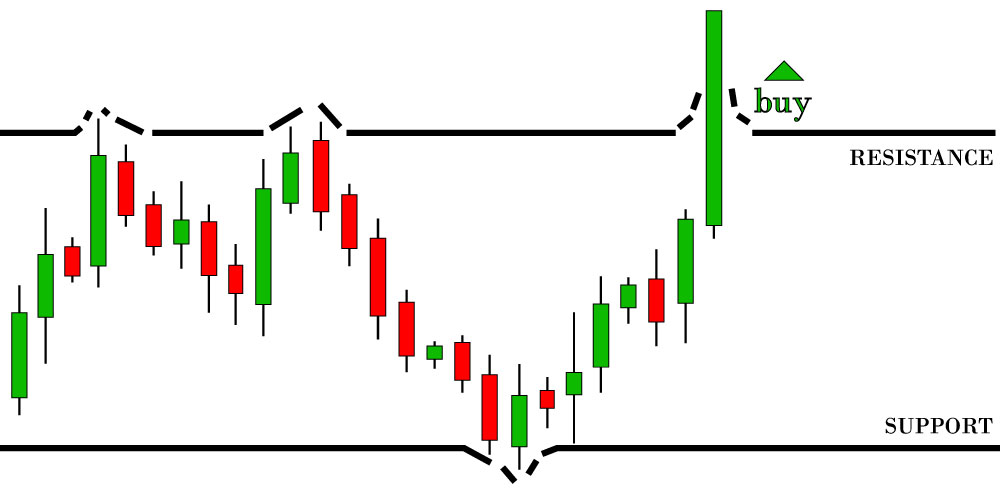
A quick refresher. Support is the level at which demand is strong enough so that price does not go lower. Why is that? As price approaches the Support floor, the stock becomes cheaper and more attractive to buyers, so price will most often bounce and go higher. The goal is to buy on the bounce or wait for a retest where price breaks resistance, goes up a day or two and then comes back to retest Support, as it often does.
Resistance is the opposite of support. It is the ceiling at which buyers are hesitant to continue buying because price is already too expensive. As buyers become hesitant to buy, sellers begin to push the price lower. Armed with this knowledge and your S/R lines, you might take some profit on a stock as it nears resistance, or you might buy a put or short the stock. Just don’t be a buyer until the break above the ceiling or pullback to the floor.
Click or tap image to enlarge.
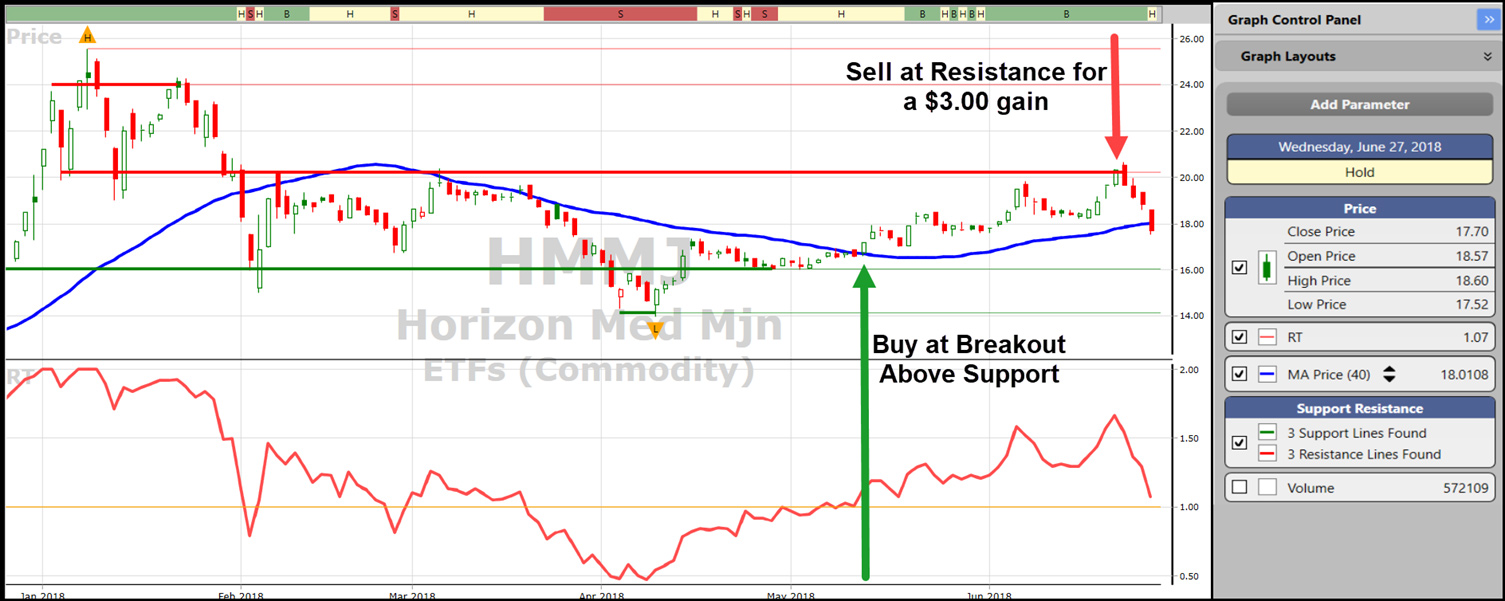
VectorVest makes trading Support and Resistance faster and easier
To set it up, click on Add Parameter in the Graph Control Panel. In the dropdown, click on Technical Analysis and then Support Resistance. A S/R box will be added at the bottom of the Graph Control Panel. Click in the square at the left to add S/R to your graph.
The default settings are quite strong. To view the settings, right click in the S/R box and then Change Settings. A menu with all the settings will appear. Hover your mouse over any of the settings to get a definition. If you feel the settings are too tight and you’re not getting enough S/R lines, you might change the Size of Reversals to Medium from Strong and the Size of the Support Resistance Zone to Average from Thin. Then change the Number of lines to Display to Show 3 Closest Matching Lines. Click OK. I also like to change the colour of the lines to green for Support and red for Resistance. Simply right click again in the Support Resistance box and choose Change Style. Select green for Support and red for Resistance and make the line medium width for greater visibility.
TRADER’S TIP: I like to have both the default S/R box in the control panel, plus a second one with my own settings as above. That way I can toggle back and forth when looking at a graph to see different S/R lines. The way to do that is to open two S/R boxes in the control panel and change the settings on one to your specifications. Then save your graph layout so that you can call it up at any time. Click on Graph Layouts at the top of the control panel. Choose Save/Modify Layouts and give your new layout a name.
Now you’re ready to analyze graphs. As you scroll through them, the S/R lines will appear on each new graph. Stock Viewer and WatchLists are two valuable sources of potential candidates.
SEARCHES: As always, VectorVest has several searches that will help you identify potential S/R breakouts. You will still need to study the graphs to find the best candidates. A couple of good ones in the Price-Volume folder are Price-Volume Boomers and Price and Volume Winners. If you have the ProTrader add-on module for technical searches, either purchased on its own or included with your RealTime subscription, the Channel Breakout – 10 Day is a good choice, as are Breaking Resistance and Breaking Support searches.
The keys to success in trading Support and Resistance is to use good risk management with your stops, be patient and take only the most desirable set-ups. You will find having your S/R lines drawn for you is a huge time-saver, allowing you to look through several graphs in minutes to find the best set-up. With a little practice, you’ll soon be NAILING BREAKOUT TRADES WITH SUPPORT AND RESISTANCE.
If you don’t currently own ProTrader and would like to try it, please click here for a FREE 30-day trial.


Leave A Comment