
by Leslie N. Masonson, MBA
VectorVest provides investors and traders with the tools and analytics to find the best performing ETFs with a few clicks. Whether you are a beginner or advanced market participant, the software provides the key metrics to identify the most appropriate ETFs for your portfolio and risk tolerance. This article will focus on VectorVest’s broadest view of the ETF universe which is provided in the ETF Viewer. Before getting more into the nitty gritty of ETF trading strategies which will be provided in future columns, we need to cover the basics. If you are not yet a VectorVest client, I suggest you take advantage of a trial subscription so you can see for yourself the value that the software provides its users.
To locate the ETF Viewer, go to the 4th tab on top of the Homepage labeled Viewers. By clicking on it, you can then open the ETF Viewer. This viewer tracks about 1,900 ETFs that are the most popular and actively traded ones while the remaining available 1,400 ETFs are not followed due to various factors including their short lifespans, low assets under management, or low trading volume or a combination of these factors.
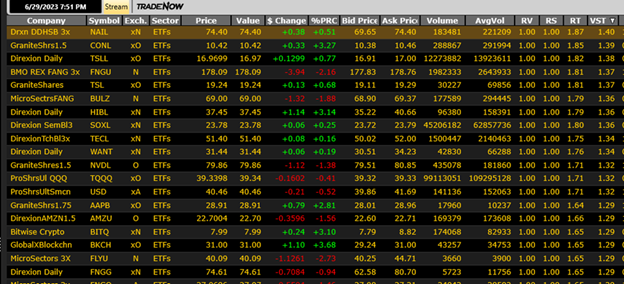
All the ETFs in the spreadsheet are ranked from the highest to lowest VST score, VectorVest’s master indicator, as well as assigned a Buy, Sell or Hold recommendation. Subscribers understand that individual stocks are evaluated for the three critical metrics which are Relative Value (RV), Relative Safety (RS), and Relative Timing (RT) which constitute the master indicator VST.
However, In the case of ETFs the RV and RS are automatically assigned a value of 1.00 which means that the VST is based on the RT. Since ETFs are composed of a portfolio of stocks their VectorVest rankings for RS and RV are indeterminable. The same logic applies to fundamental measurements including sales, earnings growth rate, earnings and growth to P/E ratio where their scores are set at zero.
The key data points included in the spreadsheet are the price, volume, and Comfort Index (CI), which is sufficient to rank ETFs. Moreover, the full complement of additional evaluation screens can be accessed by a left mouse click on the ticker symbol. These extra screens include the Full Stock Analysis Report, rankings in industry, sector and business, as well different graphs among others.
Any column on the ETF Viewer can be sorted from low to high. Moreover, by clicking on the small black box just above the Refresh Now message in the bottom right corner, a screen appears with two sets of different column choices to add or delete and save as your preference, one of which includes multiple VectorVest Fields such as VST/CI and stop price.
Checking the ETF Viewer provides users with a quick way to see which ETFs are providing the best returns based on RT and VST. You can quickly chart the top 25 for example, and place the ones with rising prices into a WatchList for further analysis and tracking. It is important to make sure you check out the Full Stock Analysis Report so that you are aware if any of these ETFs have leverage which needs to be fully understood before putting a dollar at risk.
For example, Direxion SemBL3 is a triple leveraged bullish ETF which rises 3% when the benchmark index rises 1%, and vice versa. That is why it is wise to also view that ETF’s website for complete information about the risk factors. Note that there may be a fair number of leveraged ETFs among the top 100 ranked ETFs when the market is trending strongly in either direction.
Moreover, be sure to make sure the ETF average volume is at least 100,000 for liquidity and ease of experiencing a low bid-to-ask spread. Consider using limit orders between the bid-and-ask to further reduce your cost but remember the trade may not be executed at that price and you may end up not getting a “fill”. Therefore, it may not be wise to save a few pennies on the spread to potentially give up making hundreds or thousands of dollars on trade that you missed out on.
Another key factor to consider is the Comfort Index (CI). It measures the consistency of a stock’s long-term resistance to severe and lengthy corrections. This index compares the individual stock to the fluctuation of the VectorVest Composite price that is measured on a scale of 0 to 2.00. The higher the number the more stable the stock has been over the years. This is a number that conservative investors should make sure to view. You will find that many of the leveraged ETFs have a CI value of less than 1.00 such as CONL, TSL, TSLL, and FLYU on the screen pictured below.
In creating an ETF portfolio, whether for a trading account, an investing account or a retirement account, you should consider having a diversified portfolio. That means looking at the column heading “Industry”. Obviously, selecting five ETFs from the Technology sector and five from the Consumer Discretionary sector would be problematic. In the case of a 10 ETF portfolio, for example, a more prudent approach would be to hold no more than two stocks in the same industry sector, and certainly ones that don’t overlap to some extent such as the two just mentioned. The next article will review ETFs using the UniSearch Tool.


Want These Types of Insights at Your Fingertips so You Can Win More Trades?
Use VectorVest to Analyze any stock free. VectorVest is the only stock analysis tool and portfolio management system that analyzes, ranks and graphs over 18,000 stocks each day for value, safety, and timing and gives a clear buy, sell or hold rating on every stock, every day.
Before you invest, check VectorVest! Click here to ANALYZE ANY STOCK FREE and see our system in action!


Leave A Comment