

As I write, market volatility continues. VectorVest is urging caution and erring on the side of defense. This might be a time when even aggressive investors and traders will want to wait for more confirmation of an uptrend, such as the DEW or Confirmed Call. If you do wish to buy when the futures are up and the market opens higher, consider stepping in with fewer positions and smaller shares. When it is time to buy, Stock Safety should be your primary concern.
As a VectorVest subscriber, I am sure you have heard it before. Relative Safety/RS is an indicator of risk. But what does that mean, and how should you use it?
We assign a Safety rating to every stock in our database every day. In his classic investment book, Stocks, Strategies and Common Sense, our Founder Dr. Bart DiLiddo devoted an entire chapter to the importance of RS, calling it “Stock Safety: The Missing Link.” It’s Chapter 7 and worth reading again if you haven’t already done so. You will find the most current printing in PDF format on the Welcome tab.
RS is cast on a 0.00 to 2.00 scale: the higher it is, the safer the stock.
Every VectorVest employee can recite the main definition – RS is computed from an analysis of the consistency and predictability of a company’s financial performance. It’s there in the Full Stock Analysis Report under the heading titled, SAFETY (Relative Safety/RS). You also get more information. The analysis, it says, also includes the debt to equity ratio, sales volume, business longevity, price volatility and other factors. Senior instructors also refer to factors such as company size, business longevity and dividend history. All are essential to a lesser or greater extent to the analysis of a company’s Safety.
Let’s look at the analysis components and examine the logic behind them.
EARNINGS CONSISTENCY AND PREDICTABILITY
This is number one when an investor is assessing Safety. Earnings is the engine that drives the bus, Dr. DiLiddo says. Earnings in VectorVest is a 12-month leading indicator. A safe stock is one that is making money and is expected by analysts to continue making money over the next year. For stocks we own or ones we might buy, we want EPS rising to the right edge of the graph. Price follows earnings.
COMPANY SIZE
It is fair to say that stocks of large companies are generally safer than smaller companies. Smaller companies have more explosive growth potential, but they also fail more often than larger, well-established ones. Larger companies tend to grow more slowly but offer less risk.
PRICE VOLATILITY
I find it noteworthy that price volatility is named explicitly in the Full Stock Analysis as one of the critical elements. Dr. DiLiddo writes, “Price Volatility is a reflection of fear and uncertainty.” Safe stocks have track records of steady prices and earnings performance. Favour stocks with low volatility. They are safer.
DEBT TO EQUITY RATIO
This is a measure of a company’s financial leverage calculated by dividing the total liabilities by shareholders equity. It shows the proportion of equity and debt the company is using to finance its assets. Beware of companies with excessive debt. You can spend hours analyzing a company’s financial statements, or you can simply favour stocks that have a Relative Safety/RS score above 1.0. VectorVest does all that analysis for you.
SALES VOLUME
This is the number of units sold of a particular product or service. Sales volume is a performance indicator important to the future of the company. Rising sales is positive for RS.
BUSINESS LONGEVITY
Younger companies offer some of the best investment opportunities, but they face many threats related to financial and human resources as well as potential problems with customers, suppliers, competitors, and investors. Such risks can be fatal to the company and your portfolio. A company with a long track record has well-established processes to manage effectively. Stick with the tried and true.
DIVIDEND HISTORY
Mature, dependable companies can afford to share profits with their investors in the form of dividends. Risky, untested, or faltering companies rarely pay a dividend because they need to put all their available resources toward survival. Favour companies that have a long history of maintaining and growing their dividends, in good times and bad. They regularly outperform the market.
A VALUABLE EXERCISE
In Stock Viewer, change the Sort to RS DESC. Graph the top 25 or so stocks and select a Weekly 3-year graph. Add EPS and RS to the subgraph. Notice on Franco Nevada/FNV, as RS was rising, price exploded up to about $150 from $102 in three months. Same story with Shopify/SHOP starting around 2/19/19. Look for the smoothest rising RS and EPS on your graphs and study the price performance.
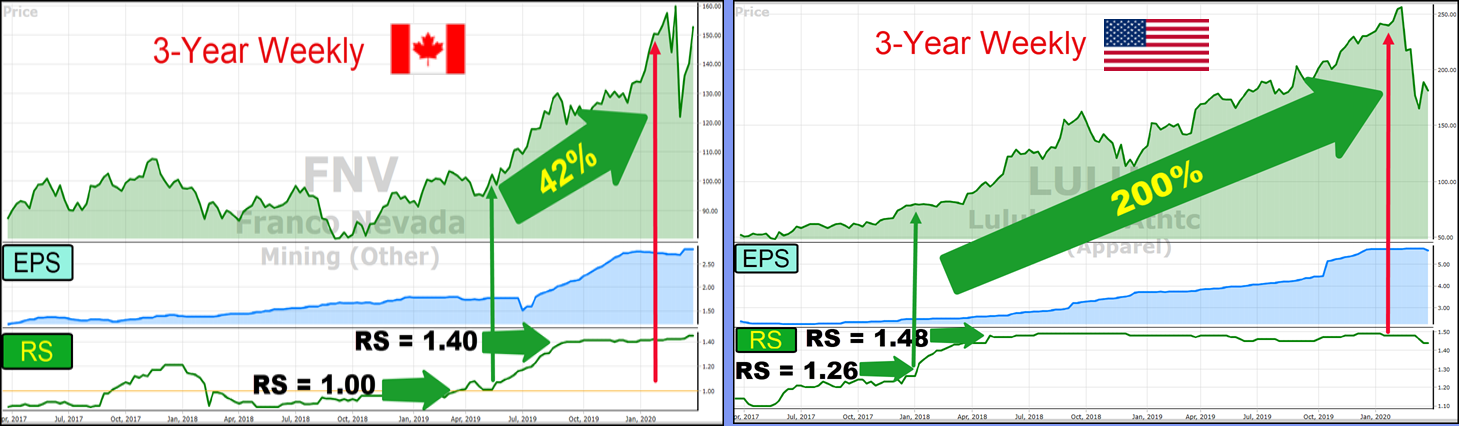
Click or tap image to enlarge.
Back to Dr. DiLiddo’s book. On page 51, he writes, “The BEST STRATEGY. When one takes into account the difficulty of picking winners, commission costs and tax consequences, the best strategy for the average investor is to create a diversified portfolio of high Relative Value, high Relative Safety stocks which require little or no trading. With above average rewards and below average risk, these stocks combine THE BEST OF ALL WORLDS.”


Leave A Comment