
Investors have endured the steepest stock market collapse in the shortest period of all-time.
Worse than the 2008 financial crisis, the dot-com bubble, Black Monday of 1987, and even the 1929 stock market crash. It was gratifying then, based on a broad survey of attendees to our VectorVest International Online User Group Forum, that since the beginning of March, 45% of our capacity turnout said they tightened their Stops and raised cash. The timeframe was after VectorVest issued a Confirmed Down Call/C/Dn in all our countries. Additionally, 26% maintained their original Stop-prices and Sold when they hit. Those results suggest most VectorVest investors had a trading or investment plan, and they stuck to it. Bravo!
We have five Model Portfolios in Canada, all uniquely designed to serve as a guide for different investment styles, processes, and goals. They all have well-defined rules. Let’s look at their performance during this period.
Here are the YTD numbers, not including Dividends, up to and including Monday, April 13th:
#1 Aggressive – +19.4%. Green Light Buyer/GLB Market Timing. Buys Long and Sells Short.
#2 Conservative – +8.6% GLB Market Timing. Buys Long only and Goes to Cash on C/Dn Call.
#3 Retirement – (-7.44%) Confirmed Calls Market Timing. Buys Long only and No Action on C/Dn Calls.
#4 Conservative – (-10.7%) Confirmed Calls Market Timing. Buys Long only and No Action on C/Dn Calls.
#5 Prudent – (-1.5%) RT Kicker Combo Market Timing. Buys Long and Sells Short.
Portfolio #1 Aggressive
The long search is Ballistic New Highs-RS. When the Confirmed Down Call/C/Dn came on Friday, February 28th, it closed all ten long positions the next trading day, Monday, March 2nd, and opened ten short positions using IG Plungers/CA. Of the ten short positions, seven were winners, all with a 20% Gain or slightly more. The losers lost about 10% each. With three new green lights starting March 6th, as per GLB timing, we now hold ten stocks long. With an ARR of 28.8% over eight-plus years, I do not see the need for any significant changes to this trading system.
Portfolio #2 Conservative.
Buys long only on C/Up Calls with Pale Blue Chips – RS. It sold all ten holdings on March 2nd, six winners and four losers. As per its GLB timing, it began buying again on March 2nd. It currently holds five positions, all in the green ranging from Newmont Gold/NGT, up 4.7% to Intact Financial/IFC, up 14.9%. Since its inception, this system has a 67%-win rate and an ARR of 25.5%. Of all the portfolios, this one gives investors the most peace of mind during a Confirmed Down Call. Its ARR since inception is 27.4%, not including the dividends, outstanding especially for a Conservative portfolio. No changes needed.
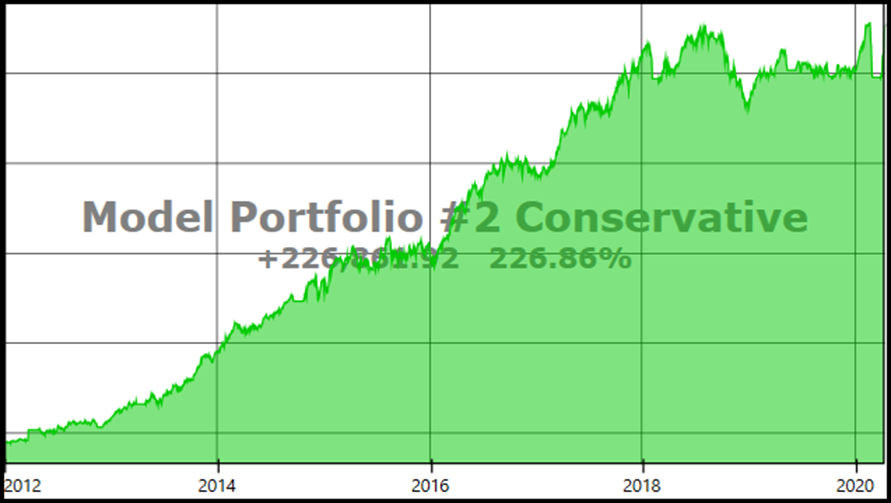
Click or tap image to enlarge
Portfolio #3 Retirement
Buys long only on C/Up Calls with High CI Rising Dividends and uses the SELL rating as its STOP. With ten open positions, two stocks sold at the February 28th C/Dn Call, and the rest on March 9th or later when they hit their Stops, including Intact Financial/IFC and Granite Realty/GRT.U which had been in the portfolio since 2017. Eight of the ten Sells closed with gains. With a 19.3% ARR, this portfolio is delivering income and dividend growth for retirement-minded investors at a reasonable Max Drawdown. No big changes needed.
Portfolio #4 Conservative
Buys long only on C/Up Calls with Steady Eddies, and uses the SELL rating as its Stop. With ten open positions, it sold two on the February 28th C/Dn Call and the rest on March 5th or later. Five were winners and five losers. The average Dividend Yield of all sold positions is over 3%, so for income investors, this portfolio is meeting the need. It currently holds no positions. With an ARR of 23.6%, the Max Drawdown since inception is 17%, not awful, but perhaps leaves some room for tweaking for a Conservative portfolio.
Portfolio #5 Prudent
Buy long on the RT Kicker Combo signal and Sells short with Crash landers/CA. The Stop on longs is VST<1.20, which can be a wide Stop, especially on quality stocks. From the trade history, we can see that short positions started to open on March 11th and continued until March 17th. Four shorts made money, and three lost money. With an ARR 30.9%, perhaps investors will not mind the Max Drawdown of 20%, but I think we may want to do some tweaking after the Coronavirus experience.
Copied below is a Performance Report table that allows you to compare all five portfolios. Now you can quickly see, HOW DID OUR MODEL PORTFOLIOS HOLD UP DURING THE MARKET CRASH?

Click or tap image to enlarge


Send me info. Thx
Hi Leonard,
Our Model Portfolios continue to perform extremely well during the recent upturn. If you would like more information, please contact me at [email protected] Thank you, and please take care.
Hi Stan,
I would like more information concerning the Model Portfolios.
Thank you,
Michael