

The Toronto Stock Exchange’s TSX jumped a remarkable 1,342 points or 11.96% Tuesday, March 24, a broad-based rally sparked by hopes of further stimulus measures by the US and other major economies. The US House put forward a bi-partisan two trillion-dollar stimulus package, the most extensive in US history, and the rally continued for at least another day. Expect market volatility to continue, however. If you do start stepping in, be prepared to step back out just as quickly.
The Primary Wave timing signal was certain to turn Up at the market open Wednesday in both Canada and the US, the first indication of a possible sustained uptrend, as noted in last week’s essay. There is pent up demand. Investors want to buy stocks at these real and perceived bargain prices. JUST DON’T GO SILLY!
There are still many issues brought on by the Coronavirus, and it’s is a long way away from getting under control. Unemployment is soaring. Businesses remain closed or downsized. Earnings season is just two weeks away. It’s an open question of how much any shortfalls are baked-in and how much will be revealed.
In our Tuesday Q&A webinars, I have suggested “stepping in” with one or two positions at a time and then adding more each day if the market continues to rise. Understand that buying stocks on the first PW/Up is an aggressive approach, regardless of how beaten down the market is. The next level of confirmation in our timing system will come when we see green lights in our Price column. Conservative investors might wait for a DEW signal or even the Confirmed Up Call.
Here’s an exercise you can do that is both interesting and enlightening. It brings some historical perspective to the size of Tuesday’s move and a perspective on how volatile and bearish the market has become. First, open in Stock Viewer PTSE, the TSX Composite Index. Highlight it and right-click to open a drop-down menu. Select VIEW HISTORICAL DATA. Click on the down arrow beside Intraday, and choose EOD or end-of-day. Open the date calendar and scroll back the Start Date to September 12, 2003, the first date available. Now, left-click on the %Price column for sorting.
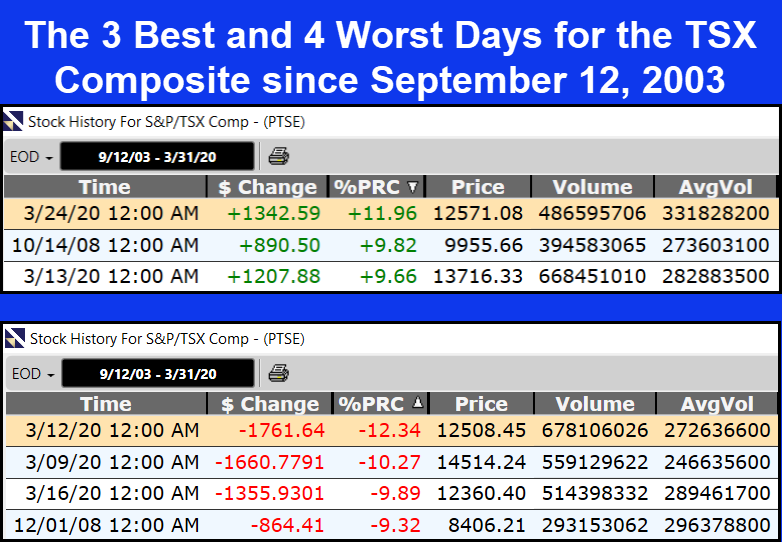
Click or tap to enlarge image
Observe a couple of things. First, Tuesday’s gain shows up at the top as the single largest %Price and points gain since VectorVest came to Canada. Surprisingly, given the overall downtrend, the third-largest increase also happened this month, a jump of 1,207 points or 9.66% on March 13. The second-largest gain was near the end of the 2008 financial crisis on October 14, 890 points, or 9.82%.
Click again on the %Price column to re-sort ascending. Notice, the worst three days in TSX history all happened in March this year, the largest a drop of 1,761 points or -12.34% on March 12. Before that, the sharpest decline was during the financial crisis, December 1, 2008, a fall of 864 points or -9.32%
As you scroll through the numbers, what becomes clear is how much volatility has increased over the years. Does it change the way we should invest? Stay tuned to our essays and Q&A webinars for more on this topic.
A SIMPLE LITTLE SEARCH
On Tuesday, one of our Q&A webinar members asked what would be a good bottom fishing search for quality dividend payers? Following up on my Friday, March 20 essay, I showed this simple little search:
SORT – RS/RT DESC
Stock Price – (Actual) > 2
Stock AvgVol >= 50,000
Stock RS – (Relative Safety) > 1
Stock DY – (Dividend Yield) > 2
The Sort is the key. Just like other bottom fishing searches, it is finding beaten-down stocks with low RT, and in this case, those with desirable RS scores. Create the search in UniSearch and save it. Then, run a few Quicktests that mirror current market conditions – i.e. the first Primary Wave Up after a market bottom where the MTI is below 0.60 and the BSR is below 0.20. For example, I ran one starting 12/31/18 to 02/21/20. Ten out of ten winners and an average gain of 32.1% or 28.1% ARR. A couple of Quicktest from the current bottom also showed positive results. I’ll gladly take those results, doing nothing more than using market timing and A SIMPLE LITTLE SEARCH.
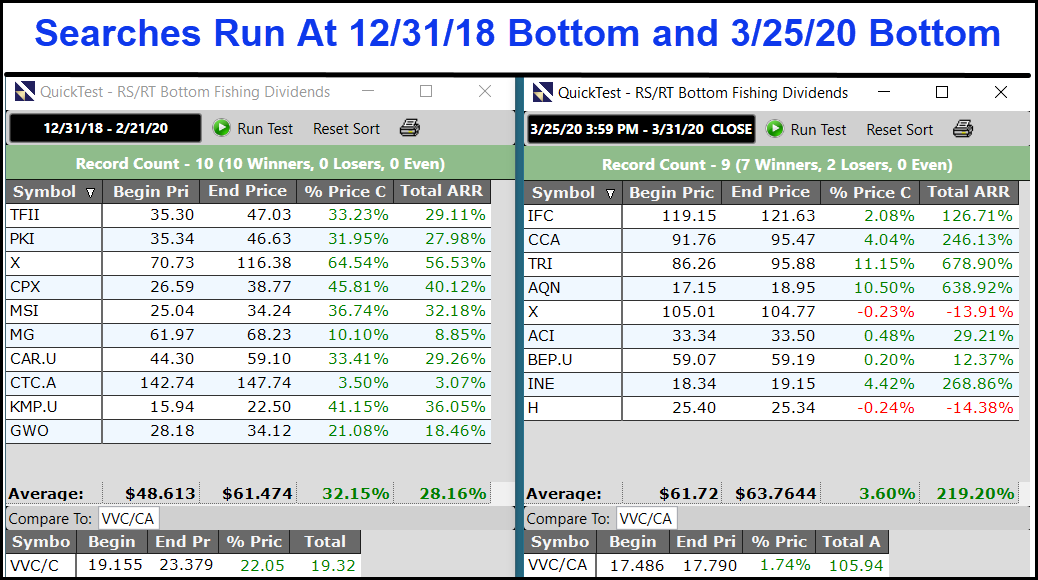
Click or tap image to enlarge


Leave A Comment