

Interesting isn’t it how investor sentiment and consumer confidence can change and move the markets? Think back for a minute: How you were feeling about the markets last October through December? Sentiment was grim, wasn’t it? I recall Dr. DiLiddo writing about how “persistent pessimism” had driven the markets into a freefall even while corporate earnings and other economic indicators were performing reasonably well. He was right on the money, as usual.
When the market eventually bottomed near the end of December, it was difficult for many investors to wipe away their short-term memory of a market in freefall and begin buying again. Persistent pessimism is difficult to overcome, unless you have a service like VectorVest. We have benchmarks. Whether you invest in the Canada or the US, our MTI and BSR indicators were at historic benchmark lows in late December, suggesting the market was near a bottom. Frist came the Primary Wave Up and then a Green Light Buyer (GLB) signal on January 4th, a reliable indication of a possible sustained uptrend.
Now we can add one more valuable indicator to our timing toolkit, the %Bullish Advisors. Dr. DiLiddo wrote about it in his January 4th, 2019 essay saying, “The %Bullish Advisors….hit an all-time high of 66.70 on January 26th, 2018 and its Trend Indicator was at an extremely Bearish level of 0.65. Being the genius that I am, I totally ignored this warning. Currently the %Bullish Advisors stands at a level of 39.30 and its Trend Indicator stands at a Bullish 1.44. Should I ignore this Bullish signal? No, I won’t.”
Again, that was January 4th, 2019, and that turned out to be excellent advice for himself and for VectorVest subscribers. The market “took off like a bird” as Dr. D. likes to say.
The %Bullish Advisors indicator is tracked and reported every Friday in the Market Climate section of the Views. For a complete understanding of the indicator, please read Dr. DiLiddo’s June 6th, 2016 essay titled, “INVESTOR SENTIMENT INDICATOR”.
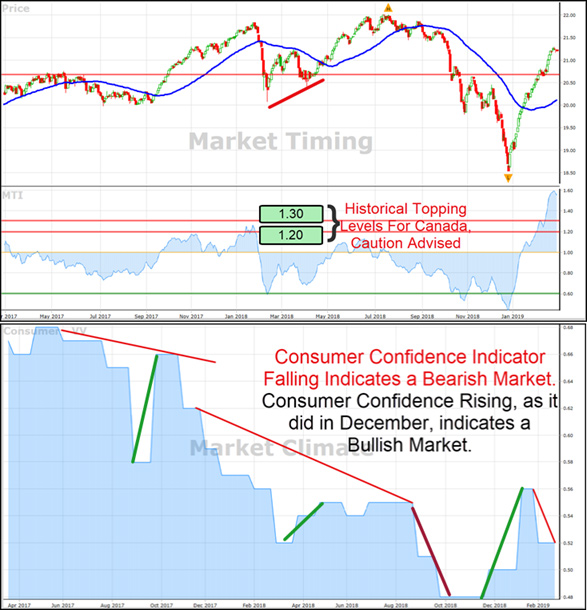
CONSUMER CONFIDENCE
We have a similar sentiment indicator in the Market Climate section of our Canadian database. It’s called the Consumer Confidence indicator. How well does it work? Well, Consumer Confidence was trending lower during most of 2018, reaching a YTD low of 0.48 in late November. Below 1.0 is unfavourable to the market and above 1.0 is favourable. The level started to rise in early December, even before the market started to rebound. It peaked at 0.56 on January 25th but has since fallen back to 0.52 on February 15th. Nothing to get overly concerned about on its own, but when you also consider our Market Timing Indicator (MTI) hit 1.52 last Tuesday, an extreme, overbought level, you should look for the market’s momentum to slow down. Often, a pullback results that can be short-lived and mild; short-lived but steep; or the beginning of a long, painful slide. One never knows for sure, but when you see these levels, it’s time to employ your best risk management strategies (please see my essay of last Friday).
As a matter of fact, Canada’s MTI rarely reaches 1.40, never mind 1.52. Historically, our topping level is 1.20 to 1.30 compared to the US where the MTI benchmark is 1.50 to 1.60. The MTI can stay at those topping levels for a while, and even go higher as it is doing now, but that’s rare. So, above 1.30 is a strong warning to start playing good defense. In other words, only buy when the Color Guard is Bullish and the market is rising, and only when you have an ideal set-up. Plan to take profits early and minimize losses on any weakness in new positions.
Click or tap image to isolate.
You should also consider tightening your stops on your long-term holds. Start using the Weed Your Portfolio techniques shown in Lesson 2 of the Successful Investing Quick Start Course on the Training tab. That has two advantages. First, it reduces your exposure to risk. This is important because successful investors know that steep losses are more harmful to your portfolio and confidence than missed opportunities. Second, it raises cash that you can deploy when the market is once again at a lower, safer level and ready to spring back up.
I confess that I have never previously paid attention to the Consumer Confidence indicator, but I will be going forward. You can see the 5-day trend in the Market Climate table, but I think It’s best viewed on the Market Climate graph where you can see the longer-term trend. Another valuable timing tool to help investors with Risk Management, THE CONSUMER CONFIDENCE INDICATOR.


Leave A Comment