

The market has delivered a remarkable recovery since the March 23rd COVID bottom. The overall market measured by the VectorVest Composite Index, VVC/CA, is up an astonishing 38.8%/133.8% ARR to July 7th, but, of course, many individual stocks have done better than that by far.
As of July 7th, Mining stocks have led the recovery with 7 of the top 20 price gainers. Uranium Miner Great Bear Resources, GBR was the best performing miner with a gain of 219% from the March 23rd bottom to July 7th. More surprising, perhaps, three Petroleum stocks cracked the top 20 list: Ovintiv, OVV – 265.8%, MEG Energy, MEG – 170.0%, and Cenovus Energy, CVG – 160.4%.
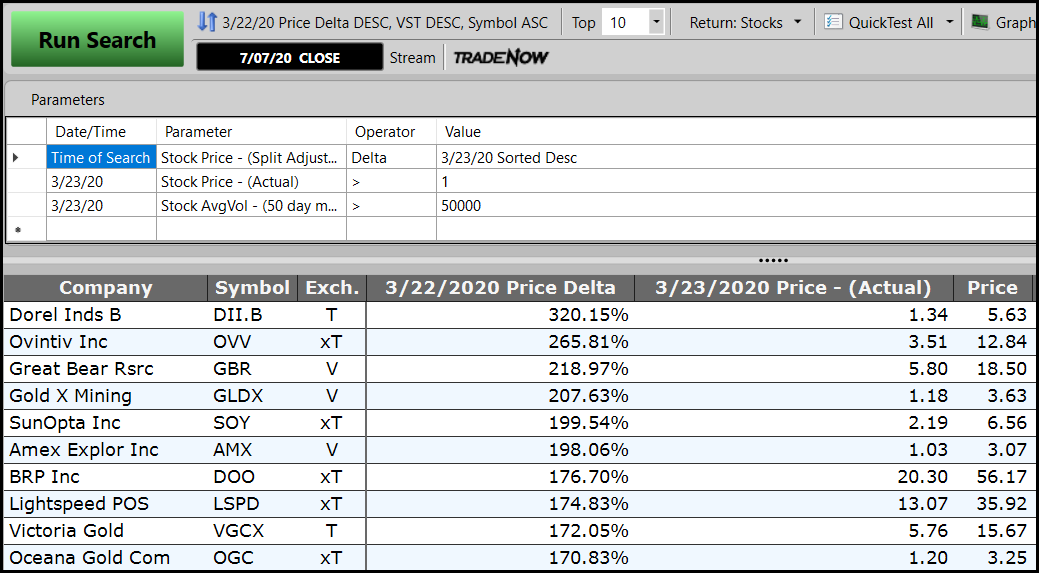
The overall leader? Many investors, me included, have been asleep at the switch as Dorel Industries, DII.B, racked up a whopping gain 320.2% gain since the market bottom, seemingly without any fanfare. Founded in 1962, the Westmount, Quebec company designs, manufactures, and distributes juvenile products, bicycles, and furniture worldwide. Bicycle sales are driving the company’s growth. One analyst wrote, “Bicycles are the new toilet paper in this COVID crisis.”
There are other surprising companies in the Top 20 list and some not so surprising like BRP Inc, DOO – up 175.7%, Lightspeed, LSPD – 174.8%, and Shopify, SHOP – 153.8%.
The best way to create your own Top Gainers List? The VectorVest “DELTA” operator in UniSearch makes it simple. Here is how I chose to do it.
| Date/Time | Parameter | Operator | Value |
| Time of Search | Stock Price – (Split Adjusted) | Delta | 3/23/20 Sorted Desc |
| 3/23/20 | Stock Price – (Actual) | > | 1.0 |
| 3/23/20 | Stock AvgVol – (50 day moving Average Volume) | > | 50000 |
Run the search on the current date or any date after 3/23/20 of your choosing. I returned the Top 20, but you could return the Top 30, 40, 50 or more. Under Value, please note that you will have to check “Specific Time” to mirror my results, same for the last two settings under Date/Time, after you select Custom Date and Time.
Click or tap image to enlarge
PRACTICAL APPLICATION
Beyond curiosity and the ability to study and analyze the graphs of the current market leaders, you can run this search regularly to track changes in leadership of Stocks, Sectors, and Industry Groups. If you do not wish to create your own search, use the searches pre-built for you in the Delta Searches folders, or modify them to suit your needs.
For example, I ran the above search on 4/6/20, the date of the DEW Up signal. That gave me a list of the Top 20 Price Gainers from 3/23/20 to 4/6/20. Then I changed the Delta Value to 4/6/20 and reran it on 7/7/20. That gave me a new Top 20 list in the period of 4/6/20 to 7/7/20. There are 13 stocks that made both lists. In other words, 13 stocks that had the largest price gains from 3/23/20 to 4/6/20 continued to make big gains from 4/6/20 to 7/7/20. How big? DII.B – 272.8%, GBR – 200.3%, DOO – 156%, SHOP – 148%, and LSPD – 109%.
You can do the same in any period going forward. To watch a demonstration of this technique, please join me for our regular weekly Special Presentation SOTW Q&A Tuesday, July 14th, at 12:30 pm Eastern. Click here for the register link.
For more information about using Delta Searches to track changes in market leadership, please read the following essays: US Views: 11/28/03 and CA Views: 11/2/19. I am sure you will be surprised and pleased how easy it is in VectorVest USING DELTA TO UNCOVER STOCK AND INDUSTRY GROUP LEADERS.


Leave A Comment