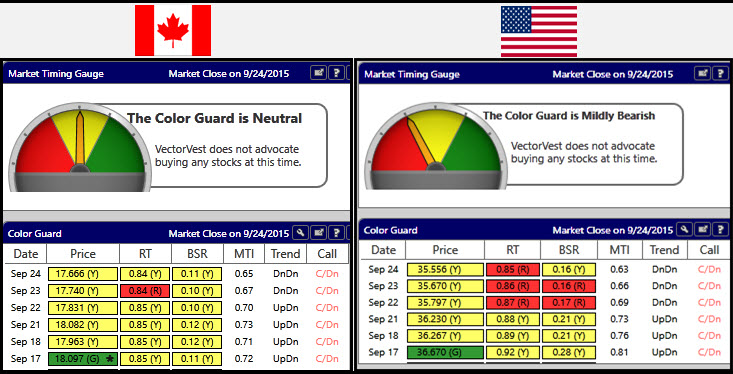
 Canada’s main stock index rallied from an early morning sell-off but still closed the day lower by 45 points or -.34%. Worries about economic growth weighed on most major sectors, offsetting a strong gain in shares of mining companies.
U.S. stocks closed lower today in a volatile session as investors awaited a post-close speech from Fed Chair Janet Yellen at 5:00 p.m. ET. (By the way: Yellen said a rate hike later this year ‘would be appropriate’). The major indexes more than halved losses in afternoon trading. Caterpillar was a drag on the market after a grim forecast and news of up to 5,000 job cuts by the end of 2016.
For a complete video report, PLEASE CLICK HERE.
TODAY’S TOP GAINERS. Gold and silver miners was the top performing index today, up more than 7% as a group. Our Gold Digger search in the Special Searches Folder was the top performing search today with an average gain of 6.98% and no losing trades. Among top industry leaders: Agnico-Eagle (AEM) up 11.23%; First Majestic (FR) 10.63%; and Barrick Gold (ABX) 10.38%. Drug company Resverlogix (RVX) was the top performing non-miner, up 10.17%.
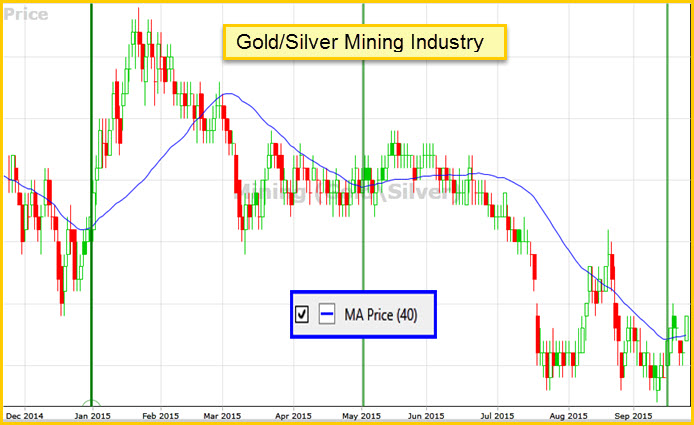
In the past, it’s often been a good time for aggressive traders and investors to bottom-fish in the gold/silver industry group when the two signals below appear, as shown below in the industry graph. Not always, but quite we can see short-term, explosive gains when the industry group starts to rise as a whole.
- The average price of all the gold/silver miners has risen above the 40-day moving average on the industry graph.
- The 40-day moving average has stopped trending down, has rolled over and started to move up.
DISCLAIMER: The information contained in this Blog is for education and information purposes only. Example trades should not be considered as recommendations. There are risks involved in investing and only you know your financial situation, risk tolerance, financial goals and time horizon.
Presented by Stan Heller, Consultant, VectorVest Canada


Exceptional colour guard report and insight as always. Interesting to see how the MTI graph held at the support line