Friday’s Special Presentation about Market Timing was timely considering our volatile and generally bearish market the last few months. If you haven’t yet viewed the Special Presentation video, you can access it from the TIMING tab, or go to VectorVest University. Then join me tomorrow, Tuesday, Sept 29 at 12:30 ET for our Q&A about the strategy and all your questions. CLICK HERE to REGISTER
 STRATEGY OF THE WEEK: “DEVELOP YOUR TRADING PLAN: MARKET TIMING.” At VectorVest, we advocate that understanding the market’s trend will have more impact on your trading success than any other single factor. To gain insights on this important topic, you can view the video recording from the Timing tab or VectorVest University.
Introducing a New Position Sizing Spreadsheet. Click here to Watch Video Instructions. On September 18, Brian D’Amico, Manager of Educational Services, delivered an outstanding presentation titled, How to Set the Right Entries and Exits. He identified a few key principles for  successful trading, and the key is planning each trade with an Entry Price, a Stop Loss Price and a Profit Target. When you do this, you will always have things under control. Whether the stock goes up or down, you’ll be in control of your emotions and your trades.
It’s also important to use sound money management techniques, including Dr. DiLiddo’s guideline of never risking more than 1% on any single trade. If you’re using technical analysis to identify your entries and exits, you’ll need to do some calculations to determine how many shares you can buy and keep within the 1% risk rule.
The Method of Calculation:
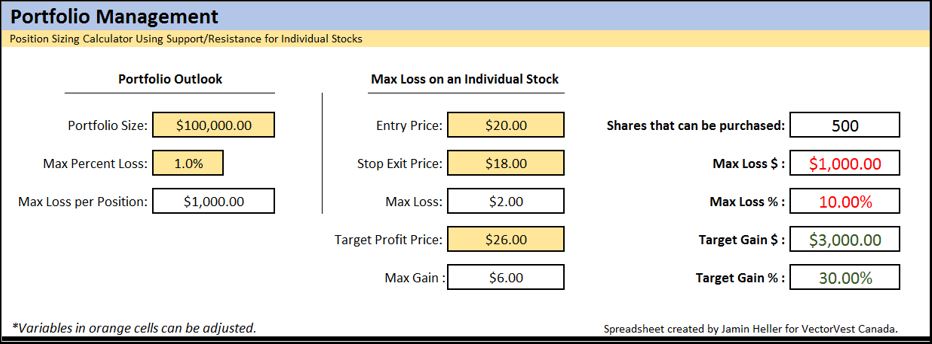
1.Calculate the maximum dollars you can lose per position using the 1% rule.
2.Divide that number by the difference between your entry price and your exit price.
Fortunately for us, Jamin Heller has created a spreadsheet to automatically do the calculations for you, giving you the exact number of share you can purchase and stay within the 1% risk rule. What I really like about the spreadsheet is that it gives you the power to easily and quickly do some ‘What If’ planning around your entries and exits, and especially the reward to risk ratio. Here’s what the spreadsheet looks like:

CLICK HERE TO WATCH A VIDEO SHOWING HOW TO USE THE SPREADSHEET.
For a copy of the spreadsheet, send an email request to [email protected]
DISCLAIMER: The information contained in this Blog is for education and information purposes only. Example trades should not be considered as recommendations. There are risks involved in investing and only you know your financial situation, risk tolerance, financial goals and time horizon.
Presented by Stan Heller, Consultant, VectorVest Canada


In the portfolio Mangement spreadsheet what does the Column D (Desired # of positions) mean 5, 10, 20. Is it # of shares, stock positions bought at different intervals, Option positions
It is not clear to me. Please explain
Thanks Stan
Gilroy
Hi Gilroy, positions refers to the # of stocks held. You’re referring to our original spreadsheet which is terrific for determining an optimal percent Stop Loss based on portfolio size, the number of desired positions, and Dr. DiLiddo’s 1% rule. You can use this tool as a guide for your overall portfolio. You may use the Individual Stock Analysis and Risk Management Calculator when you’re using stock analysis to set entries and exits. Both are useful tools that take different approaches to help you manage risk.