

Knowing which sectors are most likely to outperform the stock market at different phases of market cycles can give you an edge in your stock picking and timing. Finding that edge was the goal of an interesting exercise our Lethbridge and Southern Alberta User Group leader walked us through last Saturday.
The concept revolves around studies that show certain sectors, often represented by iShares ETFs or the individual stocks, perform better during certain stages of Bull and Bear market cycles. For example, early Bull cycles are often led by Transportation. Basic Materials and Energy tend to do well in the late stages of a Bull market. We may be seeing that now to a certain extent with rallies in mining and energy stocks since the beginning of January, except that nearly everything has rallied from there which makes it difficult to determine if we’re near the end of this long Bull market or not.
So, the studies are useful, but what’s more reliable, and more helpful, is to use the market timing tools in VectorVest along with WatchLists and QuickFolio to home in on the best performing sectors at any given time. Here’s what I mean.
After our meeting Saturday, I took the iShares Sector ETFs given to us and put them in a WatchList group which I labelled, “ETF Sectors”. I then created sub-folders for each sector that I wanted to follow: XLB – Materials; XLE – Energy; XLF – Financials; XLI – Industrials; XLK – Technology; XLP – Consumer Staples; XLY – Consumer Staples; XLU – Utilities; XHB – Homebuilders; XLV – Healthcare; and XTN – Transportation. There are others you can add if you wish.
To get the current holdings for each ETF, I went to the www.spdrs.com/en. Choose “United States” from the dropdown menu, then “Enter Site”. Now click on ETFs/US Equities/Sector. Select a sector from the new menu and click on “Holdings” from the local toolbar. A “Download All Holdings” link is shown just below the Top 10 Holdings. Open the xls file and be sure to save it with the .csv extension. You can now import the symbols right into a WatchList for each ETF. I manually added the ETF itself.
My method from there was to set the WatchList calendar date back to January 8th, 2009 and create a QuickFolio for each main sector. Set a more recent date if you want to capture all the symbols. By studying the equity curves of these portfolios, I could see that iShares is choosing mainly the best stocks available in each sector. By zooming in, you can see where uptrends begin and end. There are a lot of lengthy uptrends with these great stocks. There were many surprises on individual stocks. For example, the 5th best gainer in the Technology sector was Cadence Design, (CDNS). An unknown stock to me, it has an ROI of 1,407% over ten plus years. It’s done better than Apple for example. In every case I looked at, most stocks in each sector performed for better than the ETF. No big surprise there.
In Transportation, have you heard about a company called Air Transport, (ATSG)? It provides aircraft for lease, airline operations, aircraft maintenance and other services in shipping and transportation. It was a 0.27 cent stock on January 8th, 2009. Now it’s over $21, a gain of 7,994%! A weekly graph of ATSG shows that stock price started a steady climb in early 2013 and never faltered until the last few months of 2018, like most stocks.
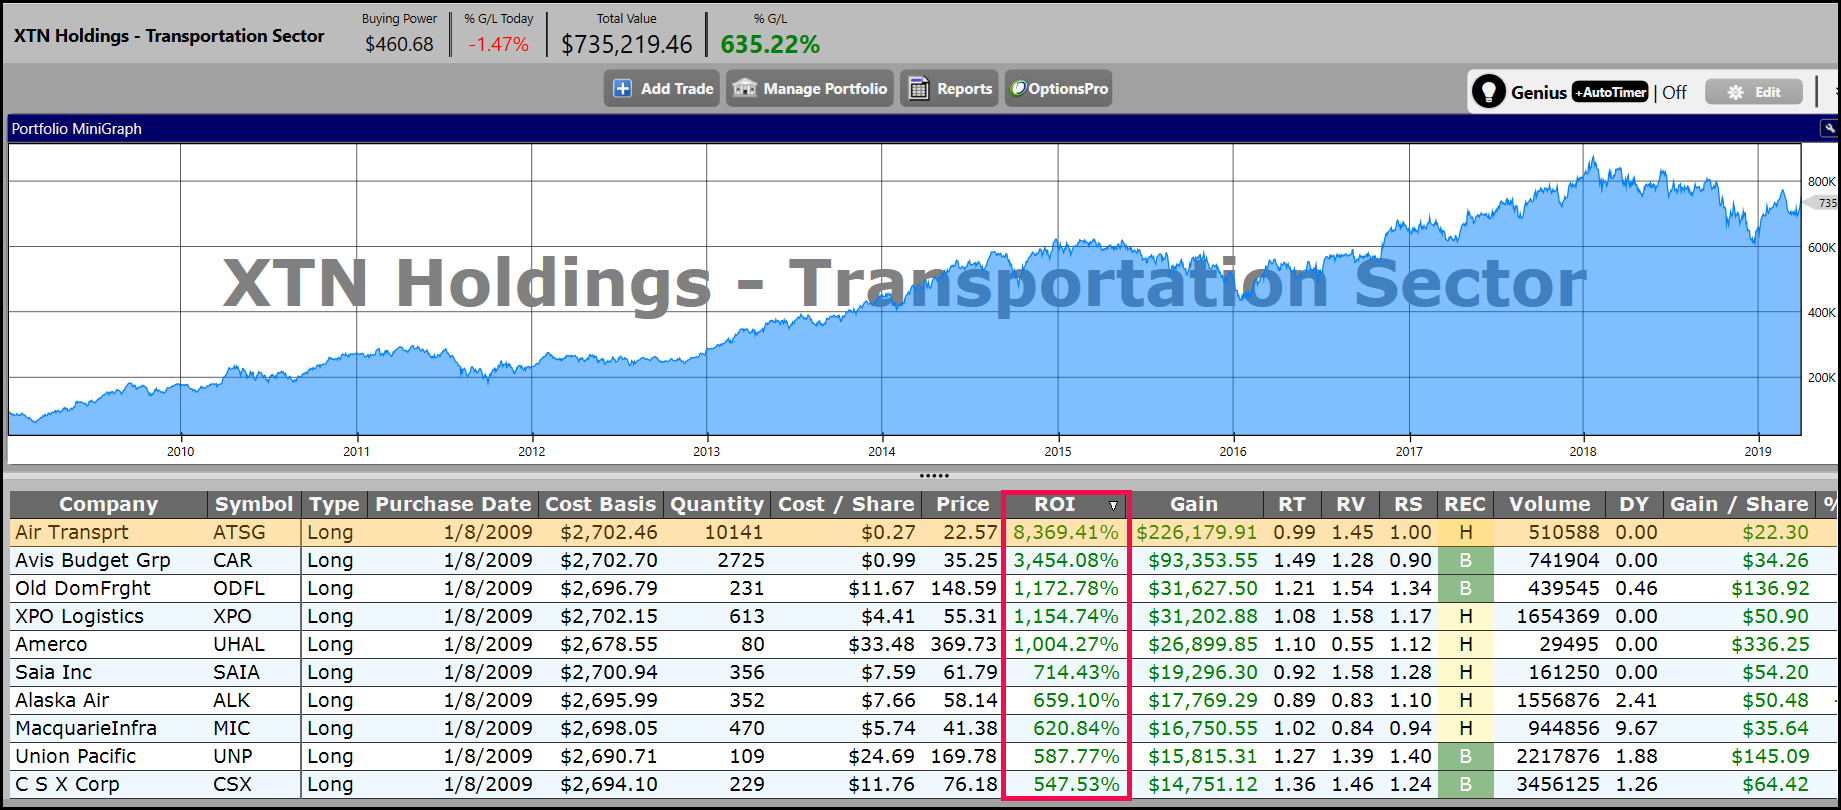
Click or tap image to enlarge.
How about Consumer Discretionary? Again, such a beautiful portfolio equity curve, it’s hard to determine a market cycle where it didn’t do well, until 2018. Ulta Beauty has a 10-year ROI of more than 4,800% while Amazon is a not so close second at just over 3,000%. Seven other stocks in Consumer Discretionary have 10-year gains greater than 1,000%.
Every sector has at least a few great companies. As we often say, it’s a good idea to hold a basket of US stocks for diversification, so why not hold the best from a few different sectors?
In Canada, unfortunately, we don’t have similar sector ETFs, but what we do have are WatchLists of TSX indices that VectorVest maintains for us. Global Gold and Income Trusts are in the TSX folder and the others are in the TSX Capped Indices folder. The stocks are handpicked by the TMX, and there’s a few gems in each sector that you can see when you create longer term QuickFolios. Studying the equity curves of the QuickFolios will let you know THE BEST SECTORS FOR DIFFERENT MARKET CYCLE PHASES.


A wise ol’ saying goes, “know your history, or be bound to repeat it”!?! This saying suggests that we should be students of history, and it turns out that knowing the history of the markets can serve us well in the realm of investing-trading. To this end, I have been reading the annual issues of the Stock Trader’s Almanac by Jeff Hirsch, and Thackray’s Investor’s Guide by Brooke Thackray, to gain insights on repeatable patterns for sectors, industries, stocks, and commodities. These repeating patterns, I like to call “the rhythms and rhymes of the markets”, as they provide diligent students with insights of prospective opportunities with varying probabilities much greater than a coin toss. There are also several trading platforms, like Best Choice Software, that highlight these seasonal moves of various components of the markets, and assist in both identifying potential repeating patterns, as well as the likelihood of them setting-up again. So knowing the markets’ rhythms and rhymes can be very valuable information to help us watch for potential setups, and also use technical analysis to confirm if a move is setting-up in our favour. Know your history, and use the technical tools to confirm the setups, and you will reap the benefits!