

Gold is commonly believed to be a safe haven in times of financial or political uncertainty, mainly because it is not at risk of becoming worthless unlike currencies or other assets bearing credit risk. Well, we’ve had bucket loads of uncertainty the past two years, but gold and gold miners have gone nowhere except in fits and starts. So, what’s going on? Will gold ever shine again, and if it does, how will we know when it’s okay to buy?
Let’s start with our US database. VectorVest gives us a conservative timer for when it’s okay to buy gold using the HUI, Gold Bugs Index, and the Midas Touch Graph Layout. Senior instructors provide an analysis about the gold timer every Monday evening in the Daily Color Guard Report. VectorVest says it’s okay to buy gold stocks when the HUI is bullish on the daily Midas Touch Graph. That occurs when the 10-day Moving Average (MA) of the Stop-Price is above the 65-day MA of the Stop-Price, and the 40-day MA of Relative Timing, RT, is above 1.00. Timeframe doesn’t matter.
Using this layout as our guide, you can see we have not had a Buy-signal since January 29, 2018. Unfortunately, there was no follow-through on January 30, 2018, so we don’t buy. The HUI continued to fall until the signal turned Bearish on March 9, 2018. In fact, the last three buy signals have been short-lived, but don’t give up on it just yet. When gold and the HUI start to run, gains can be substantial. For example, the February 9, 2016 signal lasted until September 30, 2016 and the HUI rose 58.77%. The gold index, GLD, rose only 10.62% during the same period. How could the HUI and GLD be so out of sync? It happens. It’s worth noting that the US dollar, represented by Wisdom Tree’s USDU, fell 3.36% during the same period. The relationship between the USD, GLD and gold miners is an important one, so let’s dig into it a little deeper.
First, let’s look at a side-by-side, graphical comparison of the HUI and GLD. Click on the Graphs tab, enter HUI, GLD in the stock box and hit enter. Make sure the Midas Touch is selected from Graph Layouts. A graph of HUI will appear. Click on the small icon with four squares located below the Welcome tab and click on the top two squares. Side-by-side graphs of HUI and GLD appear. Notice they have both been trending lower for a full year. HUI hit its low on 9/11/2018 and GLD a little earlier, on 8/15/2018. As of Tuesday, November 13th, the HUI is not a Buy using Midas Touch, while GLD got the signal on 10/25/2018 and immediately started trending lower. So, still time to be cautious.
One more step. Click on the small icon with four squares again, and, this time, click on the square in the upper left-hand corner. You now have the full-size graph of the HUI. Click on the dropdown arrow beside Stock under the Welcome tab and click on Performance. A Performance graph with HUI and Market (indices) will open. Uncheck or remove Market (Indices) on the left-hand side of the graph. In the Add Items to Graph area, enter GLD, USDU and hit enter. Make sure that the boxes beside GLD and USDU are checked, then right click on the black box beside each symbol and select Change Style. Choose distinctive colors and medium width for the lines. With the timeframe set to 1y, notice how the US dollar, USDU, started to rise around 4/18/2018? As the USD rose, both GLD and HUI started to fall, although the HUI fell faster and further. Look at the relationships over 5-years (5y). You’ll see that the pattern tends to repeat, not precisely, but close enough to give you more insight about when to buy gold stocks. Save your graph layout before closing.
You can do a similar analysis of gold in Canada. I like to use iShares Global Gold Index, XGD, which tracks 40-50 precious metal stocks. For a replacement for the HUI, you can use BMO’s Junior Gold ETF, ZJG. Horizons DLR is a good choice to track the USD. Follow the steps above to get additional insights.
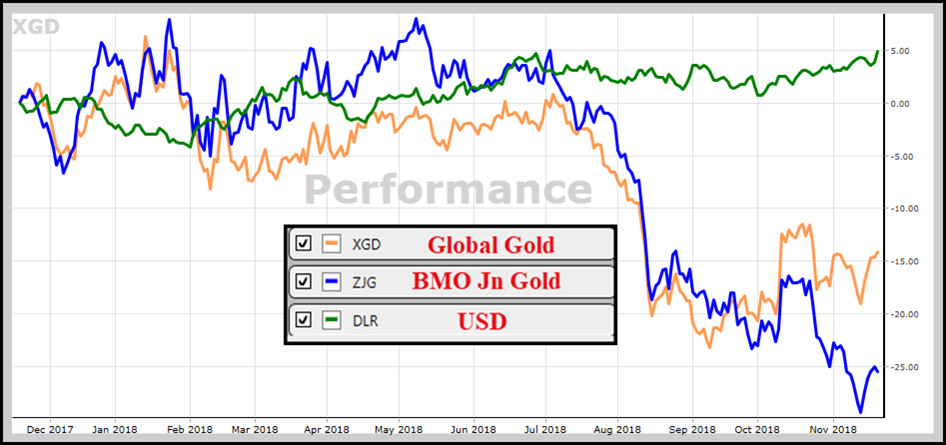
Click or tap image to enlarge.
One last analysis technique that works fairly consistently in Canada. Graph the Mining (Gold/Silver) Industry Group. When price starts to rise and crosses above the 40-day MA and the MA is flat or rising, it’s often a good time to step in and buy your favourite gold stocks, or use the Gold Digger search from the Searches – Special Searches folder in UniSearch. This proven technique can be improved by using the Performance Graph analysis described above, giving you the best chance to discover, WILL GOLD SHINE AGAIN?


Leave A Comment