

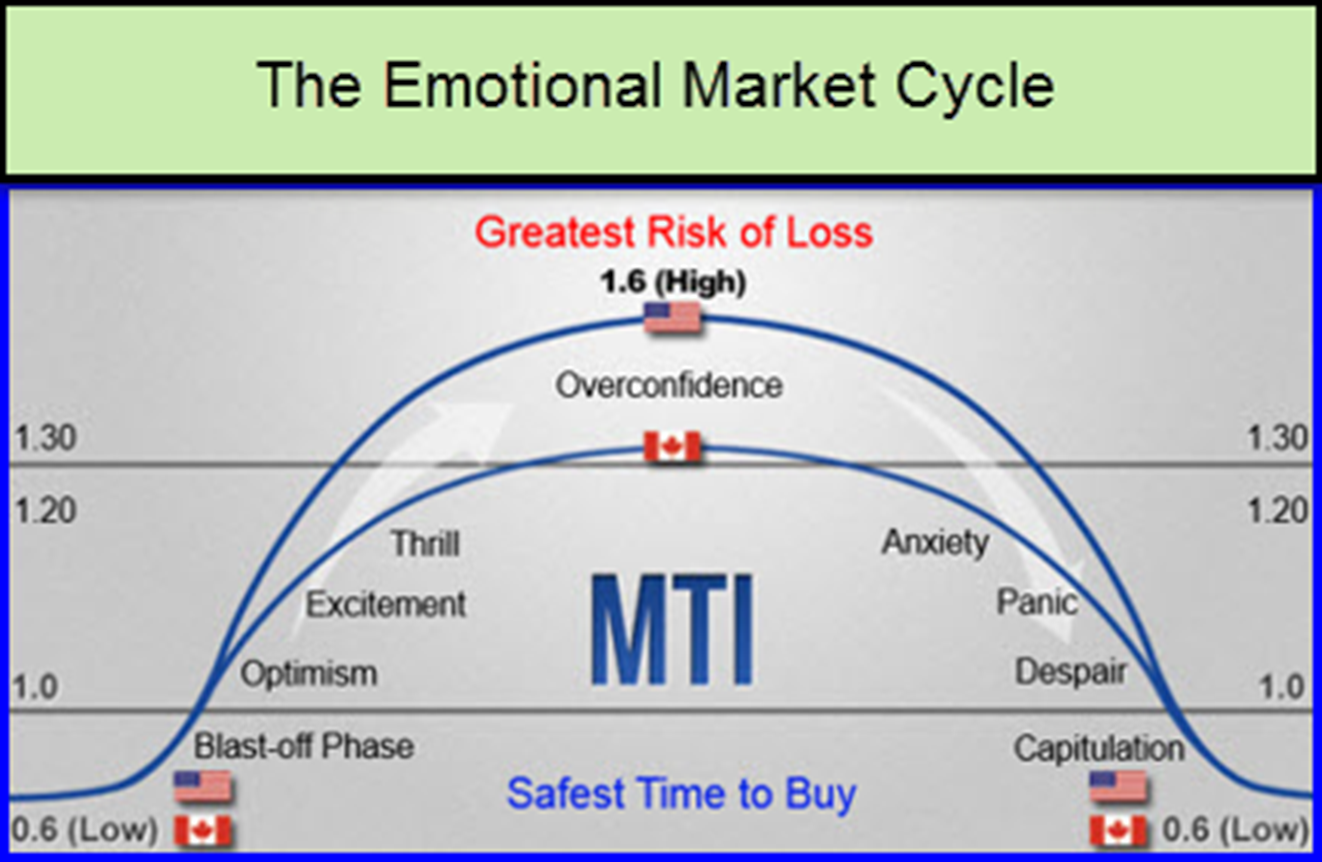
Open your web browser and type, “Graphs of The Emotional Market Cycle”. At a minimum you’ll get over 100 unique graph images and words describing investor emotions as the market moves from an oversold bottom to a rounding, overbought top, and then back down again to establish a new bottom.
Some of the descriptions would be pretty funny if they didn’t resemble me so well, especially in my early investing years. You have words like “optimism” and “excitement” as the market explodes from a bottom into a steady, rising trend. As the trend nears the top, you have words like, “Exuberance” and “I’m a stock market genius.” This is the “Point of Maximum Financial Risk” the Emotional Market Cycle states, in those words or something similar. Over-confident investors with nice-sized gains buy more. Timid investors who have been watching from the sidelines suddenly contract FOMA disease, the Fear of Missing Out. So, they dive in with both feet, just as the market is starting to lose momentum. Been there, done that.
As the market begins to rollover, right on cue with the Emotional Market Cycle, investors convince themselves they have no worries. They say to themselves, “I bought great stocks, they will come back”. Then, as the market slides like a waterfall, confidence turns to anxiety, then denial. That’s when, according to the Emotional Market Cycle, the investor now says to anyone who will listen, “I’m a ‘buy and hold’ investor, actually”.
Then comes panic, despair and finally “capitulation”. Fearful investors sell near the bottom or right at the bottom. Remember November 2008? It’s at this point the Emotional Market Cycle says, “Best Time for Investing” or “Time of Greatest Financial Opportunity”. But our short-term memory makes us afraid to step back into the markets.
SO, WHAT CAN AN INVESTOR DO? LISTEN TO VECTORVEST!
First, the COLOR GUARD gives us fast, precise guidance on the short-term trend of the market. Just like a traffic light, the colours show us when it’s okay to Buy stocks and when it’s not okay to Buy. It does not tell us when to Sell. It’s up to us to follow our STOP rules.
In addition to the Color Guard, we have arguably the most important graph in the VectorVest program, the MARKET TIMING GRAPH. Here you can place VectorVest’s Market Timing signals ranging from the Primary Wave, our fastest and ideal for traders, to the DEW and Confirmed Calls, our slowest and most conservative signals, ideally suited for prudent and conservative investors.
Most important, in relation to the Emotional Market Cycle, VectorVest has historical benchmarks that are reliable indicators of when the market is near an emotional top, and, when the market is near an emotional bottom.
What are these benchmark levels? Well, in Canada, we’re near the top of the cycle when the MTI, Market Timing Indicator, rises to about 1.20 to 1.30. That’s when we want to slow down our buying and play tighter defense with stocks that we own. Now, the market is not rational or precise, so it could still go higher for a time, although usually, a Confirmed Down, C/Dn call is not far away. If it does continue rising, we might continue buying on “up” days, but we should buy fewer shares and use the “traders’ mindset” of setting tighter stops and taking profits sooner on any weakness. In the US, the MTI topping phase or overbought benchmark is in the area of 1.40 to 1.60.
For market bottoms, the benchmarks are the same for both Canada and the US. When the MTI is near or below 0.60 and the BSR, Buy/Sell Ratio, is near or below 0.20, we say the market “is searching for a bottom”. It can go lower of course, but we’re closer to a bottom than we are to a top. At this point, if you still own a stock you should have sold earlier, it may be too late to sell now, assuming it’s a quality stock that’s just been sucked down by the market waterfall. It’s not a loss until you sell. Instead, it’s a great time to go bottom-fishing with searches from our Bottom Fishing folder, or cherry-pick your favourite, high quality stocks where prices now look attractive.
With VectorVest, there’s no excuse for any of us to get trapped in THE EMOTIONAL MARKET CYCLE.
Click or tap image to enlarge.


Leave A Comment