

Moving Averages are the favourite charting tool of many traders and investors, and for good reason. They are among the most straightforward, simple and reliable tools you can use to predict a stock’s direction.
The slope of moving average lines informs investors about the strength of any trend, up, down, or sideways. The trading concepts of divergence, confirmation, overbought and oversold, support and resistance all have their roots in moving average analysis.
The distance between price and the moving average helps us identify overbought and oversold conditions. Statistical theory says that when a stock’s price goes well above or below its normal trend line or moving average, the price will tend to revert back to the moving average.
This is called the “Regression to the Mean.” Some call it the rubber band effect. Since prices are likely to snap back to the standard trend line, the idea is to sell stocks or not buy them when the price is extended too far above the trend line. We use the 40-day simple moving average as the default.
And, it works the opposite way too. A popular strategy is to buy stocks that have fallen far below their mean average when the price starts going back up. This strategy works best, of course, after a very sharp trend has completed its course. It can backfire badly if you guess wrong about the change in direction and jump in too soon.
Both methods require a visual study of a graph that is part art and part guesswork.
But wait. There is a tool in VectorVest that turns art into a measurable science. It’s called the RMA or Relative Moving Average. VectorVest’s Manager of Research Todd Shaffer expertly explained how you can use it during last Friday’s Special Presentation Strategy of the Week video. Make sure you watch the video if you haven’t done so already.
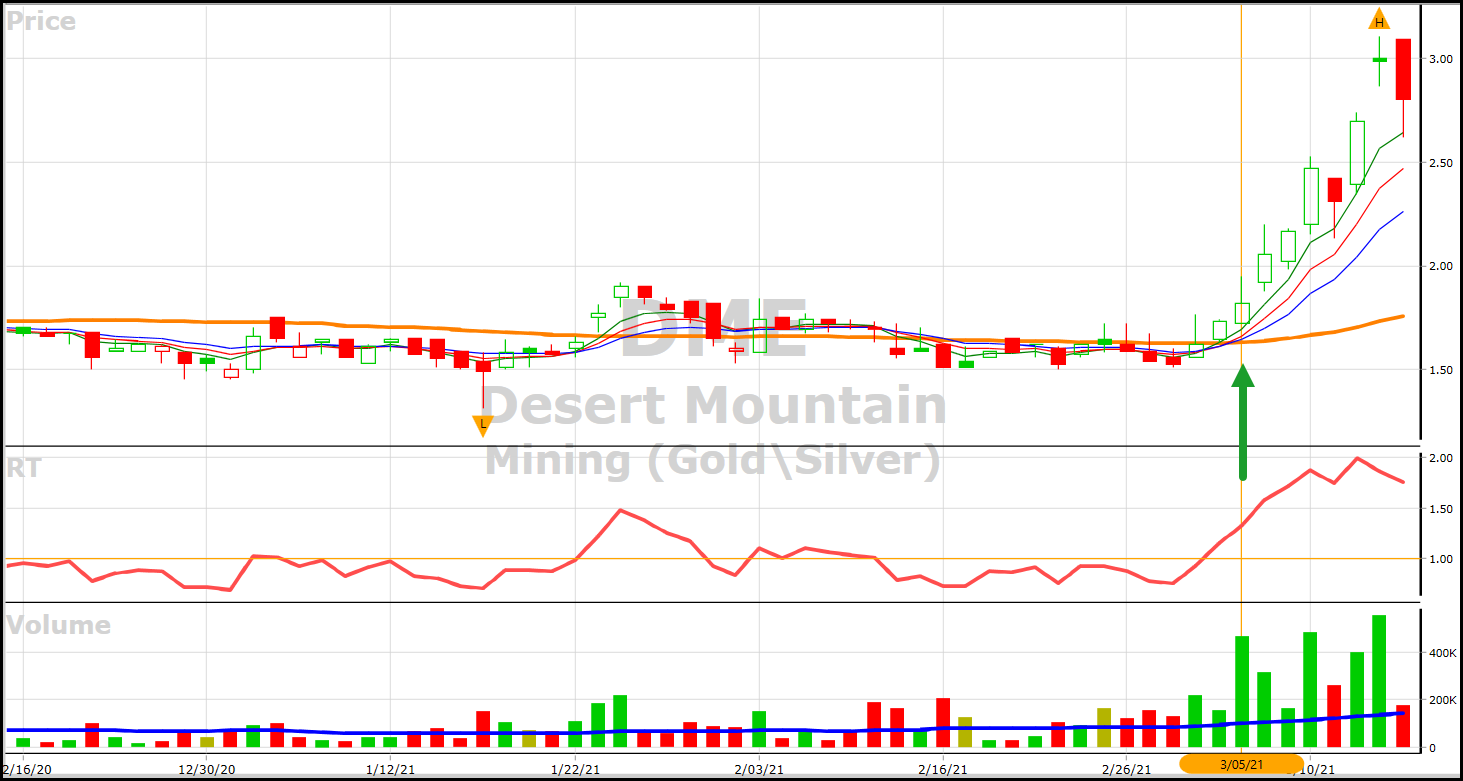
The RMA is obtained by dividing a stock’s short-term moving average of price by its long-term moving average of price. Stocks rising in price the fastest always have the highest RMAs, and those going down in price the fastest always have the lowest RMAs. To use it in searches, you will need the ProTrader add-in, which is included in your premium Realtime subscription or can be purchased separately after a 30-day free trial.
In Todd’s example, if the 3-EMA and 8-EMA have not crossed and are at the same level, the RMA point would be 1.0. If the 3 has crossed above the 8, the point would be above 1.0. A value of 1.04 means the 3 is 4% above the 8, a value of 1.10 means the 3 is 10% higher, and so on. If you want to see how far price is above or below the 40-SMA, you would divide the 1-MA, a proxy for price, by the 40-MA.
Here is a practical application. The 5-8-13 EMA Squeeze is one of several strategies we teach in the Mastering Moving Averages course. The key to the EMA Squeeze is to purchase stocks where the 5-8-13 EMAs have squeezed together and then start to separate or fan out as price begins to move higher or lower. Now we can make the strategy even better using THE POWER OF THE RELATIVE MOVING AVERAGES.
P.S.
Please CLICK HERE to see this practical application with the EMA Squeeze.
P.P.S.
MASTERING MOVING AVERAGES
If you missed this popular course last November, you will have another opportunity to jump in for the April relaunch. In addition to the pre-recorded content, there will be six new live Mastery Sessions to answer your questions and deliver new content. I am already planning to add two RMA search lines to make the EMA Squeeze strategy even better. Watch for two special webcasts near the end of March. We will introduce the relaunch with special pricing.


Leave A Comment