Want to become a more confident investor and improve your stock picking skills? Then I suggest to start paying more attention to Industry Group Analysis.
Stocks in the best performing Industry Groups are worth following. They say, ‘Birds of a Feather Flock Together’, and that’s certainly true of stocks. In fact, you can hardly go wrong when you follow a VectorVest guiding principle of buying rising stocks, in rising industries, in a rising market. Doing this research on your own could take hours, but VectorVest makes it exceptionally easy.
Relative Timing (RT), the Price Trend Indicator
The key is Relative Timing (RT), a smart indicator that tracks price trend like a stealth missile in both stocks and Industry Groups. For example, if one opens the Stock Viewer as I write this, Tuesday, November 28th, West Fraser Timber (WFT) is ranked highest by VST-Vector. Its RT is 1.41, which means that its stock price has been in a strong uptrend. That’s great, but is it a loner or part of a hot industry group?
With WFT highlighted, notice the data for its Building (Wood Products) Industry Group is displayed at the bottom of your screen. It shows the average RT of all the stocks in this Industry Group was 1.16. Not outstanding, but pretty good. If you scroll over to the right, you would see that the RT Ranking of this Industry Group was 25th. This means that 24 Industry Groups had higher average RT’s and 101 Industry Groups had lower average RT’s. Clearly, the Building (Wood Products) Industry Group is in a nice uptrend and outperforming most other Groups. If it continues rising, WFT or one of its Industry peers might be a good choice on November 28th, but could we have caught the uptrend much earlier?
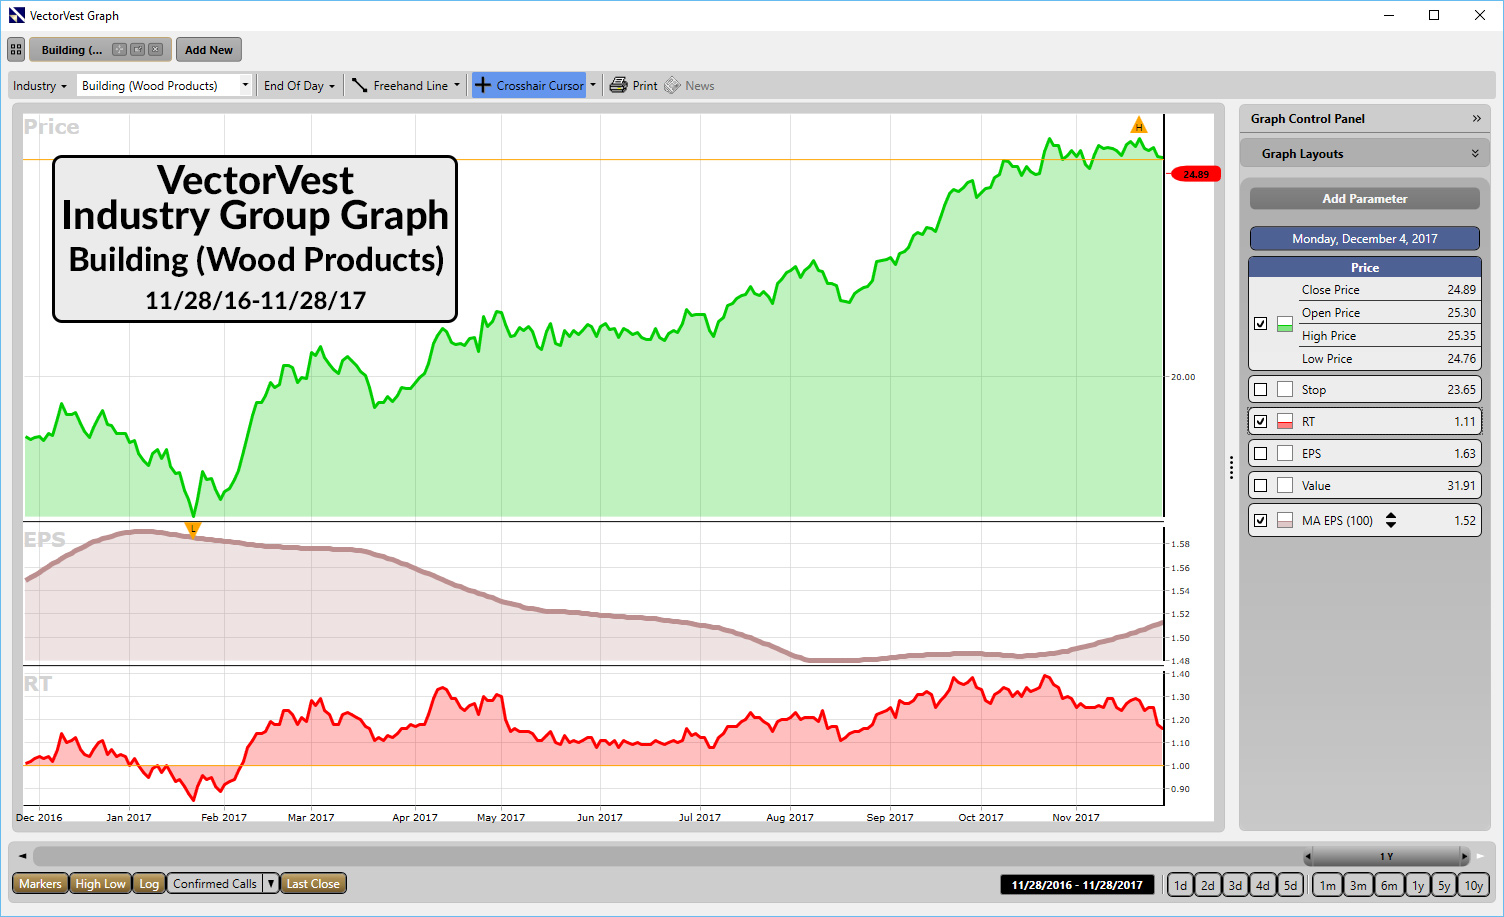
Building (Wood Products) VectorVest Industry Group graph showing price, EPS and RT
Click or tap image to enlarge.
Getting the Most Out of Industry Group Analysis
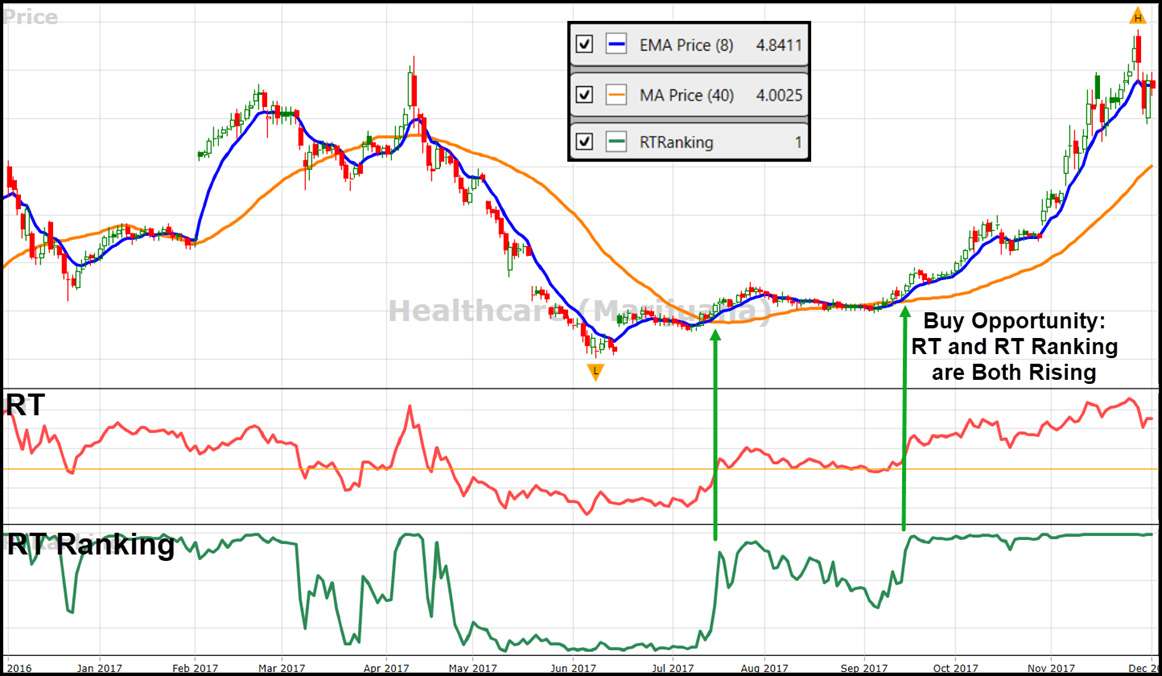
Here are four more keys to Industry Group Analysis. On an Industry Graph, when Price crosses above its 40-day Moving Average and remains there, that’s bullish. When RT is rising, crosses above 1.0 and remains there, that’s bullish. When RT Ranking is rising from a high number to a low number, that’s bullish. And when RT Ranking reaches a position in the top 10, and stays there, that’s bullish. The uptrend is firmly established. Three of those keys triggered with Building (Wood Products) around February 7th. From there, WFT has gained 63.48%. Ten of 11 stocks in the Group had positive returns to November 28th, including 8 with gains of 20% or more.
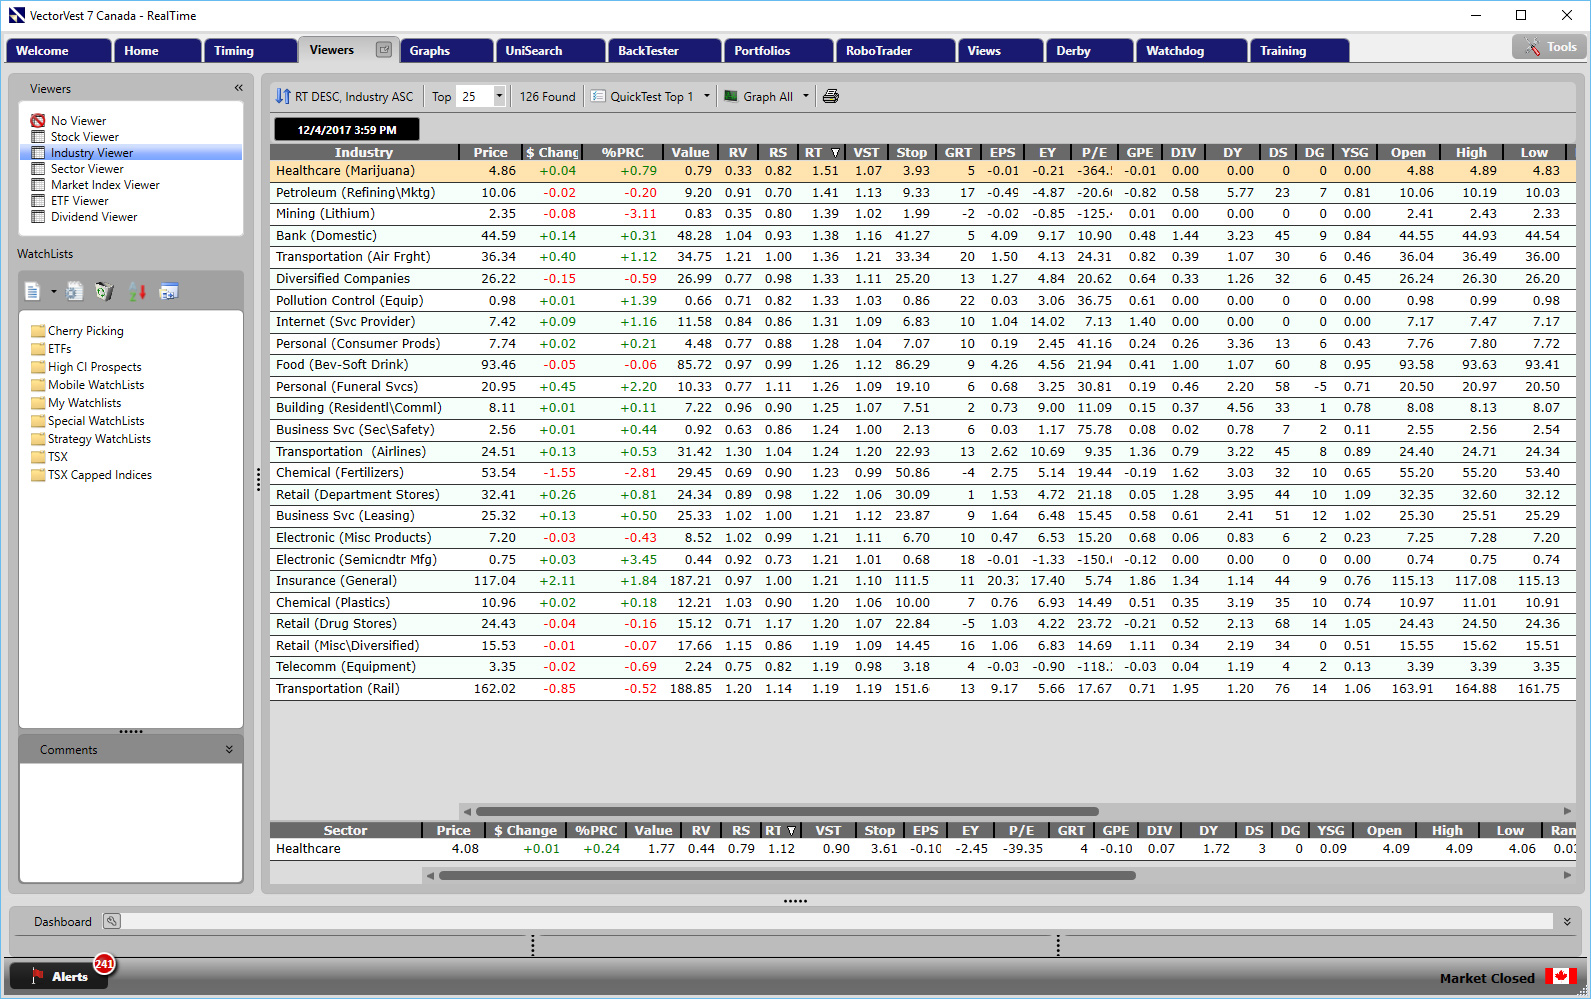
VectorVest CA Industry Viewer
Click or tap image to enlarge.
Now let’s reverse engineer this for another method to improve your confidence and stock picking skills. On November 28, select the Industry Viewer. At the top of the list sorted by RT descending is Healthcare (Marijuana). Right-click on it and choose, View Stocks In Industry Group. At the top of the list is Aphria Inc (APH). It has an RT of 1.83. In fact, 13 of the 20 stocks in the Group have RT scores higher than 1.70. Amazing! This Industry Group has been ‘flying high’, literally. There were lots of high momentum stocks to choose from this day, as long as the stock, the Industry Group and the Market continues to rise. But once again, how could you have gotten into these stocks earlier?
Well, go back to the four Industry Group Analysis keys discussed above. You’ll see Healthcare (Marijuana) stocks kicked into high gear on September 15. Since then, five of the 20 stocks in the Group have triple digit gains including my pick, Aurora (ACB), which gained 190%. At Tuesday’s date, a lot of these high flyers look extended from their 40-MA’s, so be cautious. Pullbacks should be expected. But with recreational marijuana sales set to be licensed by July, I expect the rally is far from over. With patience, you should still be able to buy in or add to your positions at good prices. Buy on the dips when a stock pulls back to the 40-MA and starts rising again.
This weekend, why not study the graphs of all 126 Industry Groups? I’m certain that when you begin to pay more attention to Industry Group Analysis, you will BE A MORE CONFIDENT INVESTOR.

Click or tap image to enlarge.


Leave A Comment