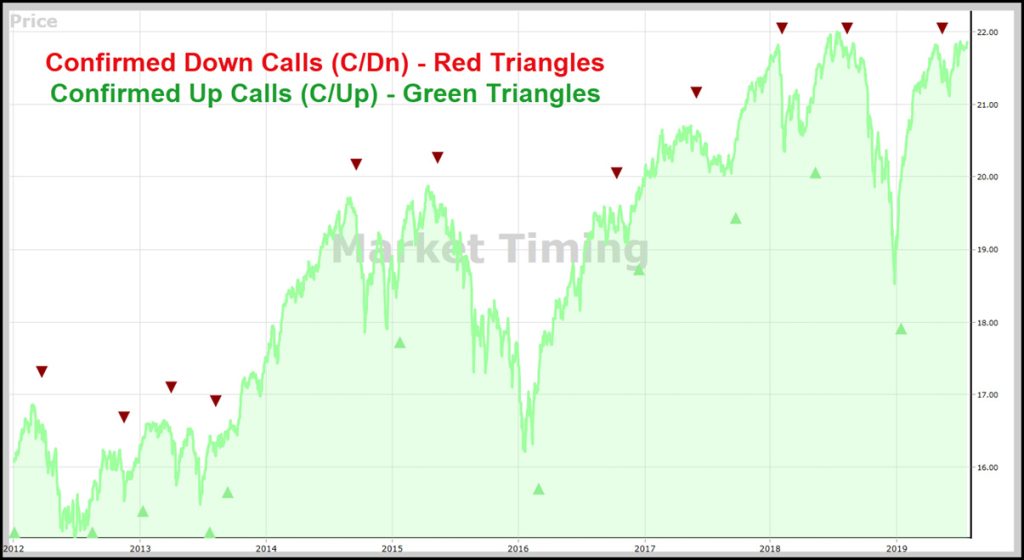
As far as Confirmed Down Calls go, the C/Dn signal received May 13th, 44 trading days ago as of Tuesday, July 16th, hasn’t been too painful. It’s just felt like it.
After a near one percent decline right after the C/Dn, the market has clawed its way back and is higher today by about 2% since the signal. It’s been possible to make decent gains buying only on days when the market has been rising, using VectorVest tools to find the best stocks. After all, we’ve had quite a few green lights in the Color Guard price column and the Goldilocks DEW timing signal arrived more than a month ago on June 14th. We just can’t seem to get that last push needed for confirmation of the Confirmed Up Call. Conservative investors who have been waiting on the sidelines are getting impatient.
What is it about this C/Dn period that appears to have investors more frustrated than at other times when the signal lasted just as long? Perhaps it’s because we got off to such a fabulous start in January that it’s frustrating now to have stalled out and gone virtually sideways since late April? Perhaps it’s because the market has yet to fully recover from the highs it achieved almost exactly one year ago, around July 19th, 2018? Or perhaps it’s because we’ve had to deal with almost daily pessimism about the global economy and the Canadian economy in particular; not to mention geopolitical concerns and our country’s political angst which seemed to escalate with the arrest of Huawei CFO Meng Wanzhou back in December.
How long can this Confirmed Down Call last? Let’s dig a little deeper. My calculation, and I’ve done my best for accuracy, shows that since the beginning of 2012, we’ve had just 11 Confirmed Down Calls. They’ve lasted an average of 78.5 trading days. The longest C/Dn was 201 days from 5/12/15 to 3/1/16. A 13.7% decline. Now that was painful. Five of the C/Dn’s were shorter than the current 44 days, the shortest lasting just 24 days from 8/7/13 to 9/11/13. Interestingly, during these short periods, by the time the market received the next C/Up, it had recovered any losses and showed a slightly positive return for the period.
By contrast, the 11 Confirmed Up Calls, C/Up, tended to last longer, averaging 93.1 trading days. The longest was from 9/11/13 to 9/19/14, slightly more than one full year and 257 trading days. Amazing! The TSX rose 19.0% during the period while the top 20 stocks ranked by Relative Safety, RS on 9/11/13 rose a whopping 45.8%.
It’s been a selective market since the May 13th C/Dn Call, evidenced by an extremely low BSR, or Buy-to-Sell Ratio. That, and a relatively flat RT, Relative Timing, seems to be the main reason the MTI, Market Timing Indicator can’t get above 1.0, the last holdout rule to getting our C/Up Call.
So, what is an investor to do? If your timing signal is the DEW or faster, best to employ strong risk management and keep new purchases small until we see improvement in the BSR, RT and MTI. Follow the guidance in the Color Guard. A top down approach by picking top stocks in top sectors is a good approach. Leading sectors include Energy, up 17.5% since May 13th, Aerospace 12.4%; Diversified 11.9%; and Mining 10.9%. Each of those sectors has one, two or three clear leaders. In Energy there’s Hydrogenics Crp, HYG, up 71% and AltaGas, ACI, up 19%. CAE leads Aerospace with a 15% gain. CCL.B tops the diversified companies with a 21% gain and Ero Copper, ERO, and Canadian favourite Kirkland Lake, KL, are among the mining leaders, up 45.9% and 21.5% respectively.
For the more conservative investor, Model Portfolio #4 continues to shine. All 10 holdings remain in the green despite the C/Dn Call, and a few hit new 52-week highs after the C/Dn. Other solid choices include New Buys and cherry picking from the Stock Viewer and WatchLists such as Midas Touch and Master Retirement WatchList.


Leave A Comment