 In last night’s Canada Colour Guard video report we discussed the possibility that VectorVest could signal a C/Dn call (confirmed down) on the Canadian market this morning if the VVC/CA (VectorVest Composite Index) opened lower. Well, the VVC/CA did open sharply lower and the market call did turn to C/Dn, as you will have noticed if you have intraday or realtime subscriptions. Then at about 10:00 a.m. EDT the market began to rally. By 11:20 a.m. the VVC/CA had recovered and turned positive, so the market call reversed back to C/Up.
So when is a confirmed call confirmed? The answer is, if it has changed after the market close.
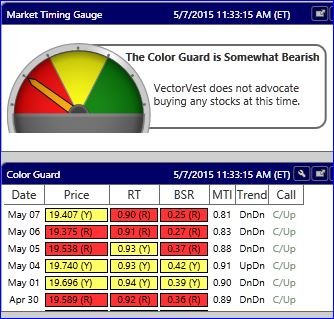
So, if the price of the VVC/CA reverses again and finishes lower than yesterday at the close today, we would officially have a C/Dn call. If that happens, we cannot get back to a C/Up call for at least two weeks until all three criteria for a C/Up call are met: 1. Price of the VCC/CA above its 65-MA; 2. MTI (Market Timing Indicator) above 1.0; and 3. Price of the VVC/CA has increased five-trading-day-period over five-trading-day-period for two consecutive five-trading-day-periods, and the price of the VVC/CA has increased from the prior day.
Right now, as of 11:30 EDT, the VVC/CA is up .17% have reversed its earlier losses. That said, VectorVest guidance remains Bearish. VectorVest does not advocate buying stocks at this time. Remember, one day does not make a trend. Prudent investors will want to wait at least until we see a PW/Up signal (primary wave) with follow-through the next day before starting to leg back into positions. The PW/Up means the VVC/CA is higher today than it was five days ago. We still have a ways to go before that can happen. So, continue to monitor the market and add to your watchlist for potential buy candidates, and most important, continue to monitor stocks you own and take action when your stop rules are met.
No rules? One idea is to use VectorVest’s four warning signs as your guide for when a stock may be in trouble and putting your portfolio at risk. Put all the stocks you own in a WatchList, sort by RT DESC, and pay the most attention to the stocks at the bottom of the list. Graph them using VectorVest’s default layout with price in candles, a 40-day MA, RT and the REC’s at the top of the graph. Here are the four warning signs:
1st Warning: Increasing volatility and price trending lower.
2nd Warning: Price falling below its 40-day MA.
3rd Warning: RT (Relative Timing) trending lower and falling below 1.0.
4th Warning: The REC turns to SELL.
Good investing everyone.
Stan Heller, Consultant, VectorVest Canada
May 7, 2015


Thanks Stan: Good practical advice, for all of us. This market volatility is keeping you busy, on a daily basis!
I happened to notice by this mornings Globe and Mail that Lethbridge, along with many other communities went 100% NDP. Things are a’changin”.
Don Fanstone
Stan, why didn’t we get the Confirmed Call today? Can it only occur on a red flag in the colour guard? With VVC below the 65-d SMA, MTI below one and 2 consecutive weeks of lower VVC price week-over-week I am confused?!? Regardless of when it comes, the Canadian markets are looking shaky especially with Energy under scrutiny with what the new NDP government will do to make Alberta’s energy sector even less competitive in the global sense than it already is.
In the words of Dylan……The Times they are a Changin’
I found it myself…….one of the subtle rules of Canadian Confirmed Down. In addition to the VVC being lower for two consecutive 5-day periods it ALSO has to be lower than the previous days close. You learn something new everyday!
Thanks Michael. On Thursday morning VectorVest signaled a C/Dn for a period of time until the market recovered later in the day. Since the C/Dn switched back to C/Up at the close, the C/Up is still in place. I explained in a BLOG post Thursday morning the rules for the confirmed calls. Also, if anyone has not yet viewed my Wednesday, Canada Colour Guard Report, I’ve had especially positive comments about my explanation of the Timing section, including VectorVest’s daily guidance in words over the previous three weeks. The video link is posted on the Blog.
Thx For keeping us informed in such a timely manner Stan
Continuously learning!
I have a trading plan that I am following and it allows me to sleep at night. It’s amazing how the quality end of the market has taken quite a beating recently. I got stopped out on CCL and LNR only to watch them gain 8% and 14% today. In retrospect, I am alive to trade another day.
Jake
Wow – those are huge moves – especially for these quality dividend payers
Is this a testament to the scary nature of the Canadian market at this time that such kinds of stocks would take such a beating in the first place ?