
By Leslie N. Masonson, MBA
Oil-Dri Corp. (ODC), is a NYSE-listed firm that was incorporated in 1941, and is headquartered in Chicago, IL. The company employs 869 individuals. There are 5 million shares outstanding. Revenues totaled $399 million, and ODC’s market cap is $ 342 million.
The company develops, manufactures and sells inert and insoluble materials to its global customer base. The material absorbs liquids and gases, and removes oil and hazardous substances from water via absorption. It also produces agricultural and horticultural products, including mineral-based absorbent products that contain biological and chemical active ingredients and drying agents. Moreover, It provides animal health and nutrition products to the livestock industry.
The stock has a limited following by 98 institutions, owning 65% of the outstanding shares, while insiders own 4.8%. Nevertheless, Gamco Investors (run by Wall Street legend Mario Gabelli) owns 8.8% of the stock, followed by Dimensional Fund Advisors at 7.5%, Blackrock at 6.7% and Vanguard at 5.3%, all heavy hitters in the mutual fund and ETF arenas. They are surely pleased with the company’s last four-month price performance.
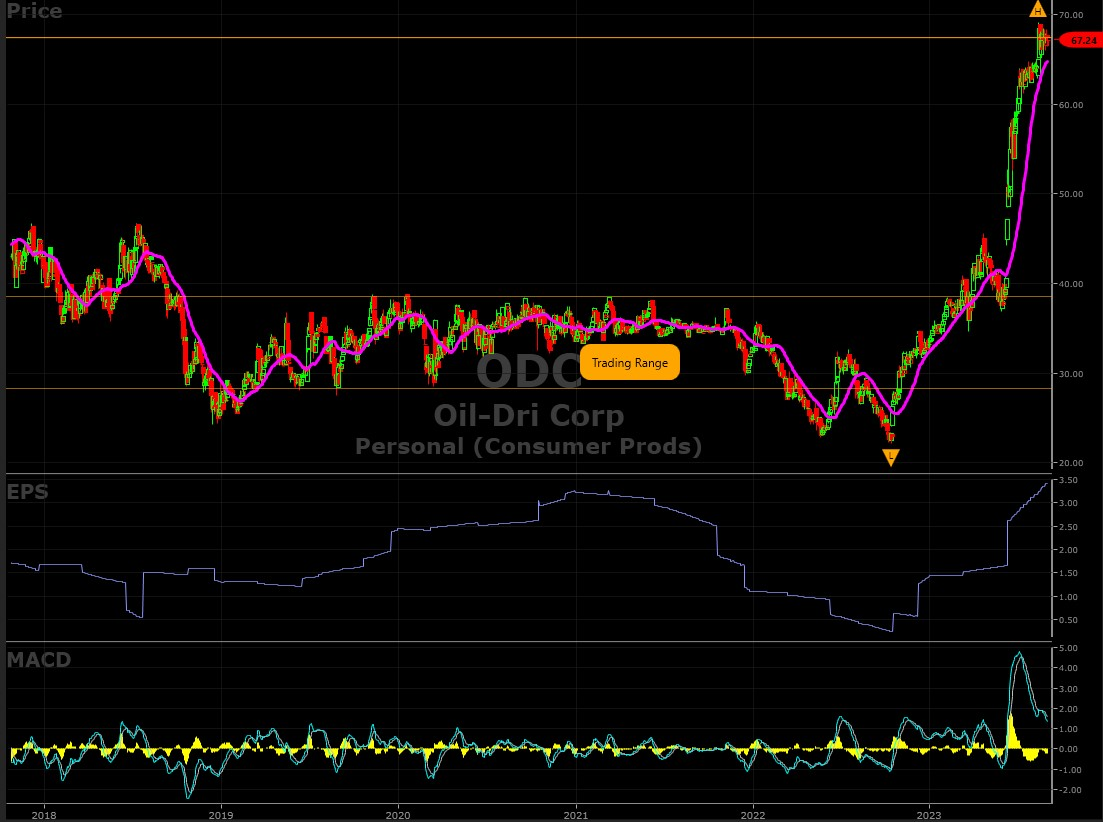
Since its October 13, 2022 low of $22.14, the stock has advanced to a high of $69.09 on August 16, a market-beating advance of 223%. After a June 9 solid earnings report, the stock gained 42.9% through September 1. Between July 7 and August 14, it had been in a tight trading range of $61.61 to $64.96. Then on August 15, it spurted higher, piercing the upper trading band thereby establishing a new all-time a day later. Now, for the last 12 days, it is floating in another tight trading band of $66.38 to $68.34. The price appears to be resting until its next surge.
ODI resides in VectorVest’s Personal (Consumer Products) grouping and is rated #1 out of 29 companies. Moreover, it is also ranked #1 in the broader Personal sector out of 73 stocks, even more impressive. Note that the Group itself is ranked a week #161 in Relative Timing (RT) out of 222 tracked industries. That is definitely a negative, as that industry ranking is in the bottom quartile. It is usually more favorable if a stock is also in a top-ranked group, since most stocks in a grouping move together. That is not the case here, nevertheless ODC stands out as is the best performer. Also, ODC offers investors an annual dividend yield of 1.73%
Oil-Dry Corp. Displays Five “Excellent” Metrics, Is Undervalued and Has Been a Top Market Performer Since October 2022 and March 2023
The VectorVest software issues buy, sell, or hold recommendation on all the 9,138 stocks and ETFs tracked. Their proprietary stock rating system boils down the data into three simple ratings: relative value (RV), relative safety (RS), and relative timing (RT). Each is measured on its own scale of 0.00-2.00, with 1.00 being the average for quick and easy interpretation.
As for ODC, its current metrics are as follows:
- Excellent Upside Potential: The Relative Value (RV) rating focuses on the stock’s long-term, three-year price appreciation potential. The current RV rating for ODC is 1.50 which is well above average. The current stock price is $67.24, while VectorVest places its value at $70.08, indicating a potential 4% upside, not requiring a big move to get there.
- Fair Safety: The Relative Safety (RS) rating is based on the company’s business longevity, financial predictability/consistency, debt-to-equity ratio, and additional risk parameters, including price volatility. Its RS rating of 1.01 is average, indicating slightly above average risk which makes it a questionable candidate for conservative investors.
- Excellent Timing: The Relative Timing (RT) rating focuses on the price trend over the short, medium, and long term. The components include price direction, dynamics, and price magnitude of price changes over daily, weekly, quarterly, and yearly comparisons. ODC has a high RT rating of 1.41 compared to the average of 0.96 for all the stocks in the database which means that the stock has been a superior performer over multiple timeframes. Moreover, its RT ranking is in the top 4/10th of 1% for this metric.
- Excellent Comfort Index: This index measures the consistency of a stock’s long-term resistance to severe and lengthy corrections. This index compares the individual stock to the fluctuation of the VectorVest Composite price. ODC’s rating of 1.73 is exceptionally high and is also in the top 4/10th of 1% of the universe. It is rare for the Comfort Index to be so high with a stock that has other excellent ratings, so that is another huge positive.
- Excellent Growth Rate (GRT): ODC’s current sales growth rate over the past 12 months has been 23%, and its forward-looking earnings growth rate is 36% (measured over a forecasted three-year period), are both indicative of a solid fundamentals. These two factors, among many others, is captured by the VectorVest software. Therefore, you can quickly get a picture of the company’s fundamental measurements with a few mouse clicks.
- Excellent VST Score: The VST Master Indicator ranks all stocks including ETFs from high to low with those stocks with the highest VST scores at the top of the list. ODC’s VST is 1.41, which is well above average. Moreover, this stock is ranked #38 in VST out of 9,138 in the VectorVest database which means it is in the top 4/10th of 1% of all stocks, quite an achievement. Using VST enables subscribers to identify stocks that are performing much better or worse than average, and ODC is clearly in the former category.
In conclusion, ODC’s superb metrics should propel the stock price much higher. Moreover, as the chart below shows, one negative factor is that the daily trading volume has been rather low and sluggish during this price advance.
With only an average daily volume of 49,000 shares and some days only about 25% of that, investors should be concerned about a wider-than-average bid-to-ask spread on slow days. Moreover, this low volume translates into meager interest by traders and institutions, which is usually the engine for further price advances. If heavier volume starts to come in, look for the price to go higher.
If you're considering adding ODC to your portfolio, ensure that the market is in an uptrend – that is not the case right now according to VectorVest. Also, check ODC's MACD for a positive uptrend (which is not the case now), and watch for the price to break above the recent all-time high of $69.
If you purchase the stock, remember to place a stop loss order just below recent $65 support level. Currently, the stock prices sits comfortably above its 40-DMA, a significant positive in a market where the major averages are flirting with their 50-DMAs.
Based on the markets mixed performance the past few weeks, now is a great time to take advantage of a 30-day trial to VectorVest, to make sure the Daily Color Guard and ODC are both on “BUY” signals before taking any action.


Want These Types of Insights at Your Fingertips so You Can Win More Trades?
Use VectorVest to Analyze any stock free. VectorVest is the only stock analysis tool and portfolio management system that analyzes, ranks and graphs over 18,000 stocks each day for value, safety, and timing and gives a clear buy, sell or hold rating on every stock, every day.
Before you invest, check VectorVest! Click here to ANALYZE ANY STOCK FREE and see our system in action!


Leave A Comment