
By Leslie N. Masonson, MBA
Gibraltar Industries, Inc. (ROCK), is a Nasdaq-listed firm incorporated in 1972 that is headquartered in Buffalo, NY. The company employs 2,117 individuals. There are 30.4 million shares outstanding. Revenues totaled $1.37 billion, and ROCK’s market cap is $2.2 billion.
Gibraltar is a leading manufacturer of building products for residential, renewables, agtech, energy, and infrastructure applications in North America and Asia. It also sells to solar manufacturers and home improvement retailers, wholesalers and contractors. Zacks recently placed ROCK on its recommended list as a solid growth stock because of its earnings growth of 17% a year, cashflow growth of 9.4% year-over-year, and upwards earnings revisions.
The stock has a strong following by 311 institutions, owning 102.9% of the outstanding shares, while insiders own only 0.74%. Blackrock, one of the top three ETF sponsors, owns 17.8% of the stock, followed by Vanguard with 17.7%. Other big-name holders include Dimensional Fund Advisors, State Street Corporation and Victory Capital Management.
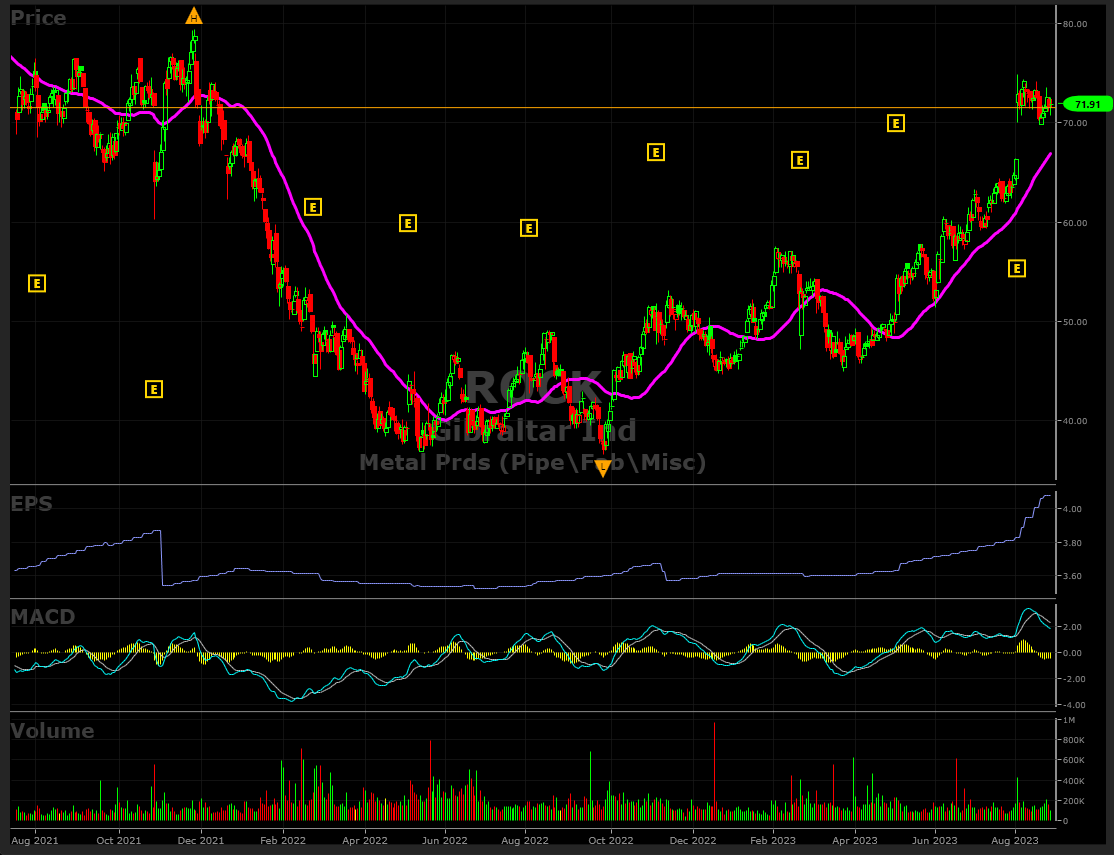
Since its September 27, 2022 recent low of $36.58, the stock has advanced to a high of $74.85 on August 2, a jump of 104.6%. After a solid earnings report earlier this month, the stock gained 9.9% on August 2. Since then, it has been consolidating in a three-week trading range of $70 to $75. The stock closed August 25 at $71.91. Resistance is at the $75 level which needs to be taken out to achieve its next key level of $79.40, the previous high on November 24,2021.
ROCK resides in VectorVest’s Metal Products (Pipe/Fab/Misc.) grouping and is rated #1 out of 26 companies. Moreover, it is also ranked #1 in the broader Metal Products sector out of 36 stocks, even more impressive. Note that the Group itself is also ranked 27 in Relative Timing (RT) out of 222 tracked industries. That is definitely a plus, as it is more desirable to invest in companies with high industry group rankings, since strong groups usually carry the strong and weak players with it.
Gibraltar Industries Exhibits Very High VectorVest Scores, Is Undervalued and Has Been a Top Market Performer Since March 24th Up 60%
The VectorVest software issues a clear buy, sell, or hold recommendation on all the 9,136 stocks and ETFs. This is accomplished through the use of a proprietary stock rating system that boils down everything you need to know into three simple ratings. These are relative value (RV), relative safety (RS), and relative timing (RT). Each is measured on its own scale of 0.00-2.00, with 1.00 being the average for quick and easy interpretation.
As for ROCK, its current metrics are as follows:
- Very Good Upside Potential: The Relative Value (RV) rating focuses on a stock’s long-term, three-year price appreciation potential. The current RV rating for ROCK is 1.34 which is above average. The current stock price is $71.91, while VectorVest places its value at $89.91, indicating a potential 25% upside.
- Very Good Safety: The Relative Safety (RS) rating is based on the company’s business longevity, financial predictability/consistency, debt-to-equity ratio, and additional risk parameters, including price volatility. Its RS rating of 1.29 is above average, indicating less than average risk which makes it a good candidate for conservative investors.
- Excellent Timing: The Relative Timing (RT) rating focuses on the price trend over the short, medium, and long term. The components include price direction, dynamics, and price magnitude of price changes over daily, weekly, quarterly, and yearly comparisons. ROCK has a very high RT rating of 1.58 compared to the average of 0.87 for all the stocks in the database which means that the stock has been a superior performer over multiple timeframes. Moreover, its RT ranking is in the top 1% for this metric.
- Excellent Comfort Index: This index measures the consistency of a stock’s long-term resistance to severe and lengthy corrections. This index compares the individual stock to the fluctuation of the VectorVest Composite price. ROCK’s rating of 1.44 is significantly above average and also in the top 1% of the universe. It is rare for the Comfort Index to be so high with a stock that has other excellent ratings, so that is another big positive.
- Very Good Growth Rate (GRT): ROCK’s current forward-looking earnings growth rate is 15% which is measured over a forecasted three-year period. This important fundamental factor, among many others, is captured in the VectorVest software. Therefore, you can quickly get a picture of the company’s fundamental measurements with a few mouse clicks.
- Excellent VST Score: The VST Master Indicator ranks all stocks including ETFs from high to low with those stocks with the highest VST scores at the top of the list. ROCK’s VST is 1.42, which is well above average. Moreover, this stock is ranked #25 in VST out of 9,136 in the VectorVest database which means it is in the top 0.2% of all stocks, quite an achievement. Using VST enables subscribers to identify stocks that are performing much better or worse than average, and ROCK is clearly in the former category.
In conclusion, ROCK’s superb metrics indicate its potential to go much higher. During the past three weeks, as the market averages have taken a 4 to 6% hit, ROCK has advanced 14.3% which is a meaningful relative strength out performance. Moreover, as the chart below shows, one negative factor is that the daily trading volume in the past three weeks has not shown any substantial jump as the price has increased. This means that traders and institutions have not taken new positions or accumulated the stock which is surprising.
If you're considering adding ROCK to your portfolio, ensure that the market is in an uptrend – that is not the case right now. Also, check ROCK's MACD for a positive uptrend (which is not the case now), and watch for the price to break above the $75 resistance level (currently below).
Once you've purchased the stock, remember to place a stop loss order just below recent $70 support level. Currently, the stock prices sits comfortably above its 40-DMA, a significant positive in a market where the major averages are just below their 50-DMAs.
Based on the markets mixed performance the past few weeks, now is a great time to take advantage of a 30-day trial to VectorVest, to make sure the Daily Color Guard is on a “BUY” signal before taking an action, as well as ROCK.


Want These Types of Insights at Your Fingertips so You Can Win More Trades?
Use VectorVest to Analyze any stock free. VectorVest is the only stock analysis tool and portfolio management system that analyzes, ranks and graphs over 18,000 stocks each day for value, safety, and timing and gives a clear buy, sell or hold rating on every stock, every day.
Before you invest, check VectorVest! Click here to ANALYZE ANY STOCK FREE and see our system in action!


Leave A Comment