by Michael Wuetherick, P.Eng.
User Group Leader, Red Deer, AB
Nov 18, 2014
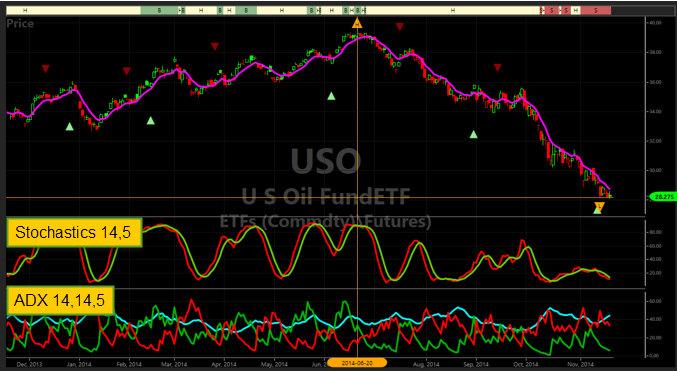
What drivers could be behind the recent crude oil price decline, and how will this impact Canadian energy companies? Using the US Oil Fund EFT as a proxy, VectorVest users can chart the movement of crude prices in North America. From its recent peak on June 20, crude prices have fallen roughly 30% over the past 4-5 months.
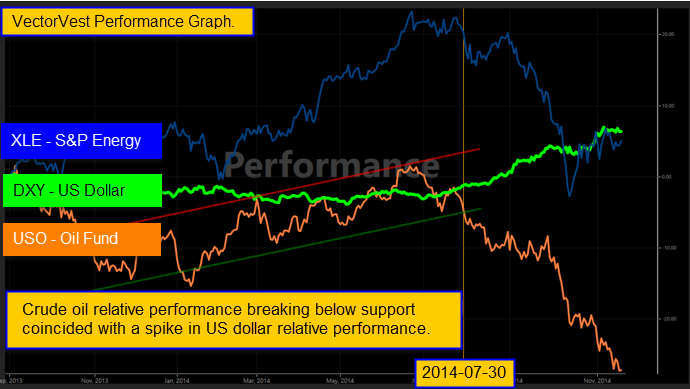
The relative strength of the US dollar also impacts crude prices, primarily as demand in emerging and energy consuming economies (i.e. Japan, Europe) shrinks as their buying power in US dollars subsides. Did supply suddenly spike, or demand dramatically change overnight? The energy industry moves fast, but not that fast! No. The price breakdown accelerated with the rise of the US Dollar index which began a strong uptrend in July 2014.
Crude oil prices are influenced by more than fundamentals and currency swings. Geo-politics, OPEC policy, technology advances (i.e. shale oil development), weekly storage inventories and pipelines like Keystone XL all have impacts on the day-to-day trading volatility…which is typically “noise” in the daily tape!
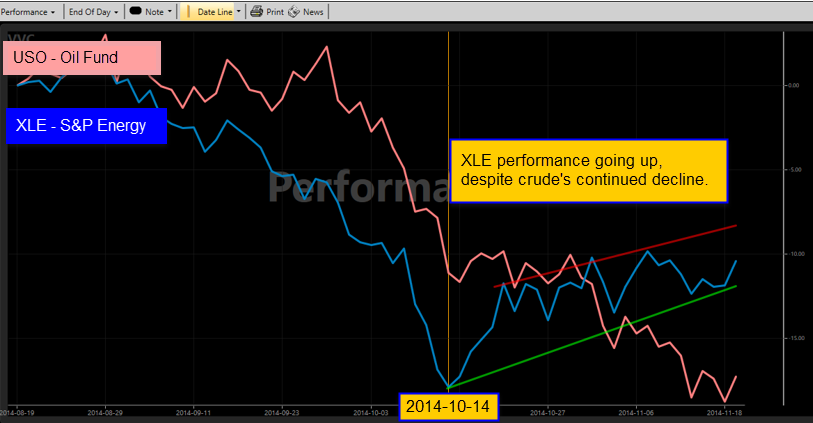
Since putting in a low on October 11th, energy equities on a relative basis are starting to diverge away from the steadily decreasing crude prices. Is this perhaps a sign of a bottom to the short-term commodity based sellers? With crude at 5-year lows are we perhaps poised for a rebound? The last time crude was this low it rebounded over 65% in four months!
Investor’s almost always over-react to short-term price declines, over-selling equities when crude falls and over paying when crude spikes. Sound familiar? CEO’s of the most successful energy companies typically will hedge their future cash-flows to ensure a stable stream of capital available for re-investment. Companies that excel at managing the financial AND technical aspects of this intensely complex industry will deliver superior results as measured by share price performance!
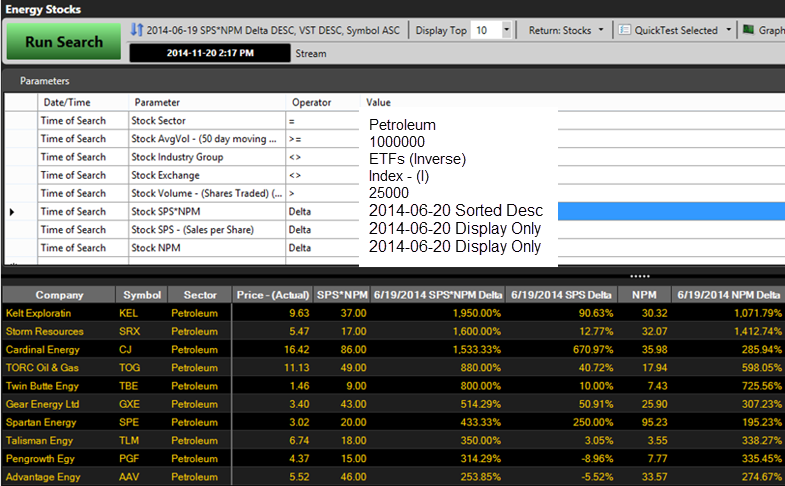
So how can you find companies that are mostly likely to withstand the current price pullback, if not continue to thrive? Simply use VectorVest’s Unisearch tool to find companies that demonstrate the largest increase in sales per share and net profit margin. Not only will these companies be growing production, but increasing net profit margin also implies more stable revenue streams. If these companies can rapidly grow SPS and NPM despite a 30% drop in crude, are they likely to perform well when prices eventually rebound? Only time will tell!
YOUR COMMENTS PLEASE: Are you buying petroleum stocks yet? What stocks are in your WatchList?


Hi Michael,
Thank you for a very informative post and a great search. I bought very small starter positions of oil companies this past week with the move off the double bottom in USO. Only time will tell if this is the beginning of a reversal. The US Dollar as of the close Friday appears very strong so I will keep a tight stop in place for now.
Petra
Petra, thanks for the feedback. As the saying goes, the best cure for low oil prices is low oil prices!! At $75 a barrel many of the worlds developing plays are right at the point of marginal economic return, therefore supply will eventually be suppressed. Meanwhile, the demand from transport (Cars, trucking, rail and of course airlines) will bask in the cheap fuel costs and actually expand their energy consumption. Economics 101 at its finest!!
I have been monitoring a few of my favorite names for long call option trades once the industry curve starts to show signs of a rebound. My go to list would include WCP, RRX, CJ, BNE, TOG, BIR and CR due to their solid management teams and high institutional investor focus. Good luck!!
Thanks for all the hard work Michael. Can you please clarify the purpose for the exact dates on the last 3 items of your criteria?
The date of the delta search coincides with the peak price of the USO oil fund on July 20th, 2014. The addition of the SPS and NPM changes from that time is to illustrate a means of finding companies who continue to grow their business despite the rapid decline in prices over the same time period. You could chose to make that date anything you want.
Share prices will continue to full as fast, or faster, than the underlying commodity. However my objective with this search was to provide a means to VectorVest subscribers to build a watchlist of growing companies in an oversold industry. When the oil price rebounds….and it will!!….these names will likely bounce back better than companies with minimal growth. I hope that helps, and thank you for your comments!
YOUR TYPE FACE IS TOO LIGHT AND NOT DARK OR LARGE ENOUGH. WHAT GOOD IS YOUR E-MAIL IF YOU CAN’t read it. 50% OF THE PUBLIC DO NOT HAVE 20/20 VISION. especially seniors trying to get dividends to survive..
Thanks for your comment Wilf. I seem to be limited in the font size and darkness, but I will ask around for some help with this to see if we can make some improvements. Thanks again.
I don’t expect energy to stay down any longer than 6-12 months, as it’s replacement with alt. energy sources are still far in the future, despite the EPA. So with good yields, and good production rises, Michael’s list looks like a good place to be.
Hi Michael,
Thank you for this information. This search will five us more information on the energy companies. Upon building your search, I had trouble with the SPS*NPM. Was this build in the “custom fields”? I could not find it in the VectorVest fields.
Thanks again,
Ken
Ken, I did build a simply custom user field to define the SPS*NPM criteria. You will find both SPS and NPM as single entities within the VectorVest field.
Again this search isn’t necessarily recommend to use for buying these stocks right now! Rather it is to highlight the companies who have demonstrated an ability to grow the top-line (SPS) and maintain a high NPM(low operating costs, positive hedging impact etc.) since the start of the oil decline on June 20th.
Oil will rebound, but when is the question. Personally I think its best to wait for market confirmation of the end of the beat down trend currently going on. The sector is looking oversold so keep your eyes open for a reversal for some possible bottom-fishing candidates!
Hi Michael,
Interesting work you have done here – but for me, the strategy may be a little too complicated and I hesitate to deal with those volatile energy and mining stocks and ETFs as my trading failures in those sectors will attest.
Good Luck in your trading !
Barry
Commodities are not for the faint of heart Barry! They are the definition of volatility in both short and long term! I actively trade the energy space both long and short depending on the market conditions, but betting long term on any one trend is difficult given the complexity of the underlying commodity markets.
I have used the SPS*NPM delta search throughout my VectorVest stock screening to highlight companies with rapidly growing sales and profits per share regardless of the industry. Other indicators such as GRT, EY, RV, DY, DG etc. will also give you excellent information on a company’s growth potential over the long term (i.e. quarter over quarter).
Consider it a tool to consider when you have numerous interesting stocks on your watch list but not sure which ones to buy! Delta searches are one of the most powerful techniques that VectorVest has to offer….embrace the unknown!