
AVOID PETROLEUM STOCKS FOR YOUR DRIPS
Written by: Stan Heller
My February 10th Essay about the DRIP advantage generated considerable correspondence and discussion at our regular Weekly Market Update Q&A. I was asked, “Why didn’t you include any petroleum stocks in your shortlist of top Dividend Reinvestment Play candidates?”
It’s a fair question. After all, there are several popular energy stocks in VectorVest’s DRIP WatchList, including Suncor Energy (SU), Pembina Pipeline (PPL), Cenovus Energy (CVE) and Imperial Oil (IMO). Petroleum companies continue to rake in huge profits in 2023; however, the Ukraine/Russia war premium has disappeared, at least for now.
So, what’s the real reason I didn’t include one or two petroleum stocks in my DRIP shortlist? The key advantages of DRIPs, such as compounding, zero commissions on dividends, and dollar-cost averaging, cannot overcome petroleum stocks’ cyclical and volatile nature.
Let’s face it, the long history of the oil industry is one of boom-and-bust cycles. Look at this 10-year graph of VectorVest’s Petroleum Sector.
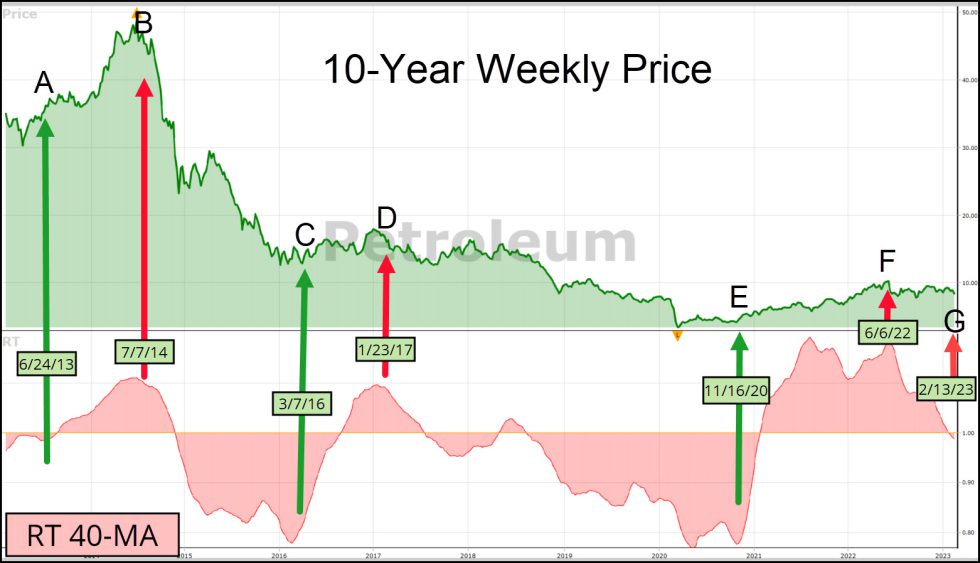
Here are how a few Petroleum DRIP stocks might have fared during the boom-and-bust periods, buying and selling between the arrows.
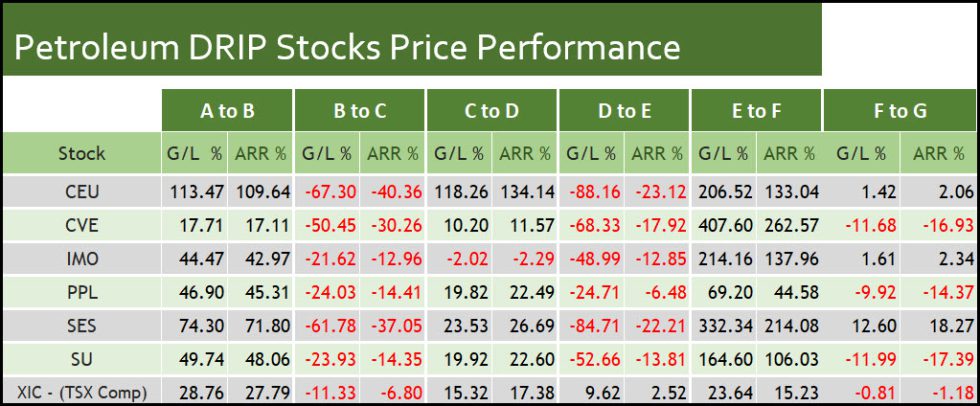
The average performance of these stocks looks pretty reasonable. There are more winning periods than losing and some gains are massive. Secure Energy (SES), Cenovus (CVE) and CES Energy (CEU) averaged better than 47% per year. Pembina (PPL) was the laggard at 12.88%, which would be more than acceptable to most investors, especially after the dividends are factored in. The study does show that massive gains are possible when buying petroleum stocks at the start of a boom and selling during the busts.
But that’s not how DRIP investing works. It’s buy and hold, reinvest the dividends and add to your positions regularly, usually quarterly. Below is a QuickTest to show price performance if you bought 10 years ago on 6/24/13 and held to 2/13/23, ignoring the booms and busts.
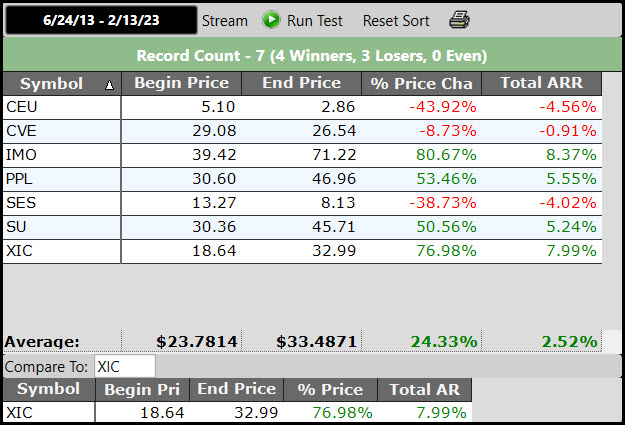
So, the results are not terrible when considering the dividend payments plus compounding would have substantially added to the net returns, but they are not great. Interestingly, the XIC representing the Capped TSX Composite Index would have outperformed all but Imperial Oil over the ten years. 7 of my top 10 candidates would beat Imperial Oil and not one of my picks was in the red.
Take one final step before you decide to add Petroleum stocks to your DRIP portfolio. Study the long-term graphs using the modified NPI layout I showed in my February 10th Essay. Displaying EPS and Dividend payments are especially revealing. Then you can confidently decide if you should AVOID PETROLEUM STOCKS FOR YOUR DRIPS.


Leave A Comment