A large number of VectorVest members enjoyed two outstanding keynote presentations at Saturday’s International Online User Group Forum.
First, VectorVest’s UK Managing Director David Paul demonstrated a simple yet highly effective method of using weekly graphs to trade high quality, undervalued stocks. It makes an excellent style of trading for any busy investor and especially those who can only focus on the markets during weekends.
Second, Michael Wuetherick, Energy insider and User Group Leader for Red Deer, AB, delivered a comprehensive analysis of oil and gas markets, explaining how to play them with more precision. Michael’s analysis showed how VectorVest investors can profit by focusing on producers and service companies in the world class Permian and Montney plays.
To view the recording, CLICK HERE NOW.
Are you looking to simplify your trading? David Paul has been teaching his Weekly Zone Trading method to institutional and retail investors for several years, and it couldn’t be simpler using your VectorVest program. First, he created a search with two simple lines of criteria in addition to the powerful VST DESC Sort:
- Stock Value/Price >=1.2 This ensures the stock is undervalued by at least 20%.
- Stock CI – (Comfort Index) >= 1.3 This ensures the stock has persistent price performance with a price history showing its ability to resist severe or lengthy price declines.
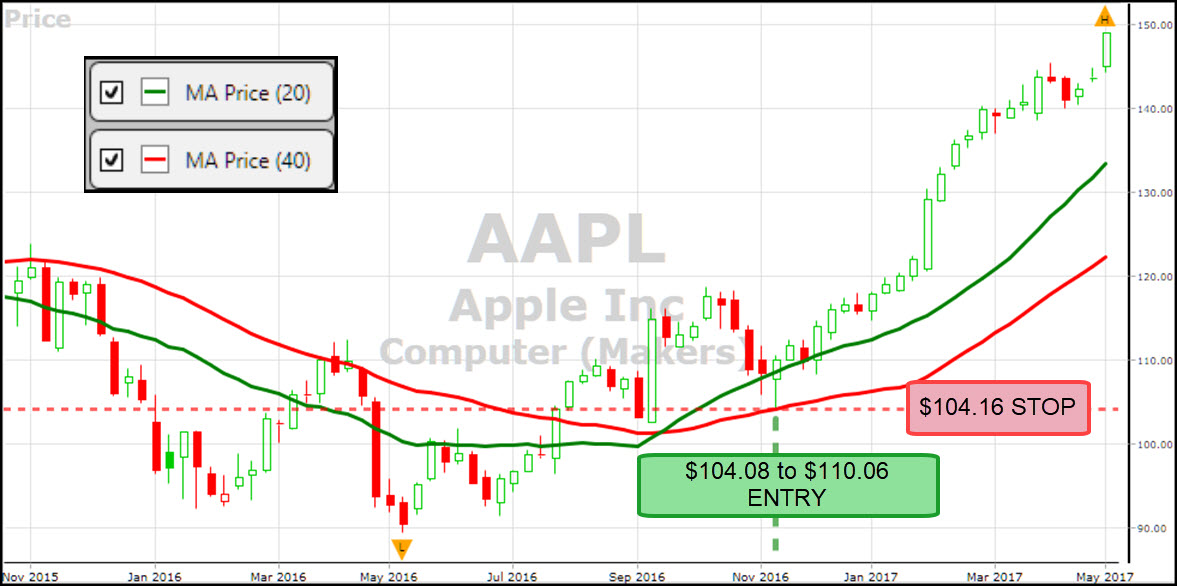
That’s it. You’re now ready to study some graphs. Choose the Weekly graph option from the drop down menu. Use a timeframe of at least 18 months and up to 3 years. The next step is to add two moving averages to your graph, the 20 and 40 Simple Moving Averages. If you right click on the blue header above ‘Price’ in the control panel to the right, a drop down menu opens that says, “Add Moving Average”. Choose 20 and 40 and select them from the bottom of the control panel to place them on your graph. You can now save your graph layout for quick access in future. Please call Support at 1-888-658-7638 if you need help with these details.
Quite simply, if the 20 week MA crosses above the 40, then the trend is Up and the opposite for a Dn trend. Using weekly charts clears a lot of the noise allowing you to see the big trends more easily and clearly. David’s technique does not try to find the start of a trend nor does it try to get you in when the 20 first crosses the 40. Instead, the technique gives you a BUY signal when the 20 is above the 40 and price has pulled back into the Zone between the 20 and 40 weekly averages. In addition to buying only high quality stocks in a rising market, risk is managed by placing a tight stop slightly below the candle prior to the trigger candle or slightly below a Support Zone.
When you see a set-up like Apple in the graph below, “Roll the Dice” as David likes to say:
Finally, David also demonstrated a few of his favourite Bar/Candle Reversal Patterns. 1. Pin bars or hammers. 2. Morning and Evening Stars 3. Inside Bars 4. Outside Bars / 2 bar outside reversal 5. Popguns. View the recording to see examples.
Energy Sector Overview. In his presentation, Michael Wuetherick reviewed the volatility and seasonality of crude oil and natural gas sectors. He showed why companies doing business in the Permian and Montney shale plays should to be on our radar, and he handed us a WatchList of companies with exposure to these outstanding plays.
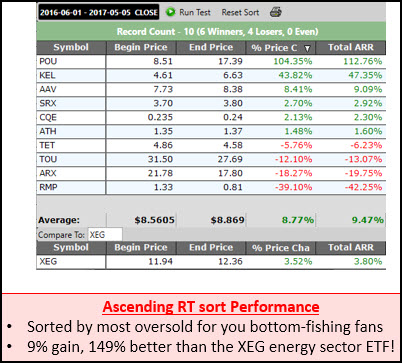
Once you have added Michael’s WatchLists to your VectorVest program, you can now use Michael’s updated Energy Driller search which uses a filter on the WatchList. The search will deliver the top stocks in the WatchList that that are the most oversold using the RT*CI SORT. From there, Michael suggested using the 3/8 EMA crossover as the BUY signal. While there’s uncertainty around the OPEC meeting set for May 25, analysts like Michael expect OPEC to extend the cut-back toward achieving a fundamentally driven supply-demand marketplace. He added, “Watch for expanding costs in the drilling and services sector as a sign that the growth of the US shale plays might slow down just enough to let oil prices creep back up slowly.”
Below are VectorVest QuickTest results from the Montney Shale Operators WatchList during a Petroleum Sector rally March 1, 2016 through June 30, 2016.
THANK YOU DAVID and MICHAEL. On behalf of our VectorVest Community, I want to thank David and Michael for their enjoyable and valuable presentations. Below is just a sample of the many kind comments that were chatted in:
Q: Many thanks Stan to you & the 2 exceptional presenters. Both were fascinating & would be a welcome addition to future presentations.[john
Q: Outstanding day from all points. Thanks.[Mel
Q: Another excellent forum Stan. So appreciate this time every month[Audrey
Q: Wow! Very good stuff. A lot to digest! Many thanks to Stan, Paul and Michael.[Michel
Q: All of the International Forum speakers have excellent, Stan, this guy amazing!! Love the British humor and the clear examples from real life trading. Thanks.[Alan
Q: C: Wonderful to have Michael explain the high level overview of the Energy sector and apply it to trading techniques. Excellent thank you.[Jim
Remember, you can advance, rewind and pause the recording as needed.
For a copy of the slide presentation, contact Stan Heller at [email protected]
You’re Invited to our Tuesday, May 9 Q&A Webinar! Friday’s Special Presentation Strategy of the Week  (SOTW) video was all about Bottom Fishing to take advantage of Trading Opportunities of a Lifetime. Interestingly, the best performing 1-day Derby Search Friday in both Canada and the US were Bottom Fishing Searches! Stocks from these search should be on your radar in a WatchList. On Monday, if the market rallies continue, look for the stocks in your WatchList that are moving up after the market open. To learn more, join me for our regular Tuesday, May 9 SOTW Q&A at 12:30 pm Eastern. CLICK HERE TO REGISTER. We’ll look recent Bottom Fishing opportunities in both CA and US, and give you a checklist for how to spot them on your own.
To View previous Online Forum video replays, click on the recording links below:
January 7, 2017 – Stock Chat hosted by Stan Heller, Consultant VectorVest Canada
December 3 – My Three Friends: Value, Price and Earnings by Mike Simonato, Ontario VV Member.
November 5 – Guide to Worry-free Investing with Dr. Bart DiLiddo
Posted by Stan Heller, Consultant, VectorVest Canada
DISCLAIMER: The information contained in this Blog is for education and information purposes only. Example trades must not be considered as recommendations. You should always do your own analysis and invest based on your own risk tolerance, investment style, goals and time horizon. There are risks involved in investing and only you know your financial situation, risk tolerance, financial goals and time horizon.


Leave A Comment