At our live workshops, we often talk about the market cycle of emotions. We use the graphic below to show the cycle. What it shows is that many investors tend to buy too near the top when markets have already been going up for a sustained period leading to excitement and overconfidence. It’s sometimes called the FOMO effect – Fear of Missing Out – and they get in too late. The party is almost over. And because they missed out on the big gains, they tend to hold on too long, only to sell near the bottom when the market is oversold. That’s the ‘capitulation’ or ‘I can’t take it anymore’ phase. It’s often the worst time to sell.
A problem for many investors is they don’t have a reliable, measureable methodology to know when markets are overbought and when they are oversold. REGISTER HERE FOR TUESDAY’S Q&A WEBINAR. WE’LL DISCUSS BOTTOM-FISHING AND STUDY A FEW STOCK IDEAS.
VectorVest Uses History and the MTI To Identify Tops and Bottoms. Fortunately, VectorVest provides a 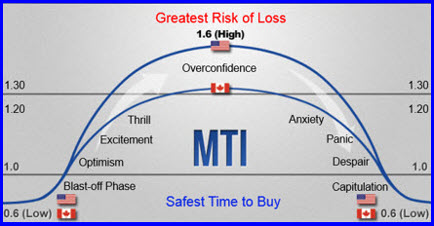 Market Timing Indicator (MTI) and Graph that we can use to measure historical S&R levels. It helps identify when markets are near a top and near a bottom. In Canada, we know the market is near a bottom when the MTI falls to around .60 and below. It means the market is more likely to go up than fall too much further. VectorVest Founder, Dr. Bart DiLiddo, calls this the ‘blast-off’ phase.
The market is near a top in Canada when the MTI rises to around 1.20 to 1.30. In the U.S. market, the historical bottom is the same as Canada at .60 or below, however, the top is closer to 1.50 to 1.60.
How Oversold is Our Canadian Market Right Now? Rarely does the MTI fall below .50, and when it does, a strong rally typically ensues. At the close Thursday, Jan 21, the MTI was .47 and it was .46 on Wednesday. So our market is extremely oversold. Thursday afternoon the price of oil began to rise and so did our market. Friday morning, Jan 22, the futures were up and we finally had a follow-through day. A Primary Wave was signaled early in the day, suggesting that now might be a good time for more aggressive investors to start buying stocks long again. However, Dr. DiLiddo cautions that Prudent investors are generally advised to wait for a green light in the price column for confirmation of a new, potentially sustainable uptrend – the Green Light Buyer method.
So how does one make money under these market conditions? You go bottom-fishing of course. Senior Instructor Jim Penna showed us how to do it in his fabulous September 11, 2015 Special Presentation SOTW video. Had you watched it when Jim gave his presentation, you would have known that you could have made great profits bottom-fishing from the September 28 bottom. VectorVest Canada’s bottom-fishing searches started to blast-off this week. Interestingly, if you went bottom fishing in Canada on Thursday and held the same stocks through Friday, S&P/TSX SmallCap/RT is up 17.79%; Bottoms Up/CA up 15.16%; Jail Break/CA up 13.20%; S&PTSX MidCap/RT up 13.15% and TSX Composite/RT up 11.77%. The top performing stock was HNL, up 42.11% in the S&P/TSX SmallCap/RT search. BTE, up 39.39 in two days, was found by 4 of the 5 top bottom-fishing searches. However, as a note of caution, if you bought a new basket of stocks at Friday’s open using the same searches, despite a 353% gain in the TSX, only S&P/TSX SmallCap/RT was up on the day with a 1.13% gain. At the same time, bottom-fishing searches in the US on Friday delivered fantastic results. Go figure!
Canadian investors Friday favoured energy, industrials, utilities, financials and telecoms with stocks that weren’t coming to the top in bottom-fishing searches. I still think Monday might be a good time for bottom-fishing if the market continues to rise. However, the takeaway is that you must always use good money management as shown in the SOTW video and wait for follow-through on any stock that you intend to buy (stock is rising from the open).
 Want to learn more? Please join me for our free, weekly SOTW Q&A Webinar Tuesday, January 26 at 12:30 EST. REGISTER NOW. We’ll look at the market in RealTime, study the best-performing searches and stocks, and answer your questions about Jim’s Bottom Fishing presentation. We will also discuss the results of my long term study of ‘oversold’ market conditions as shown in the chart below.
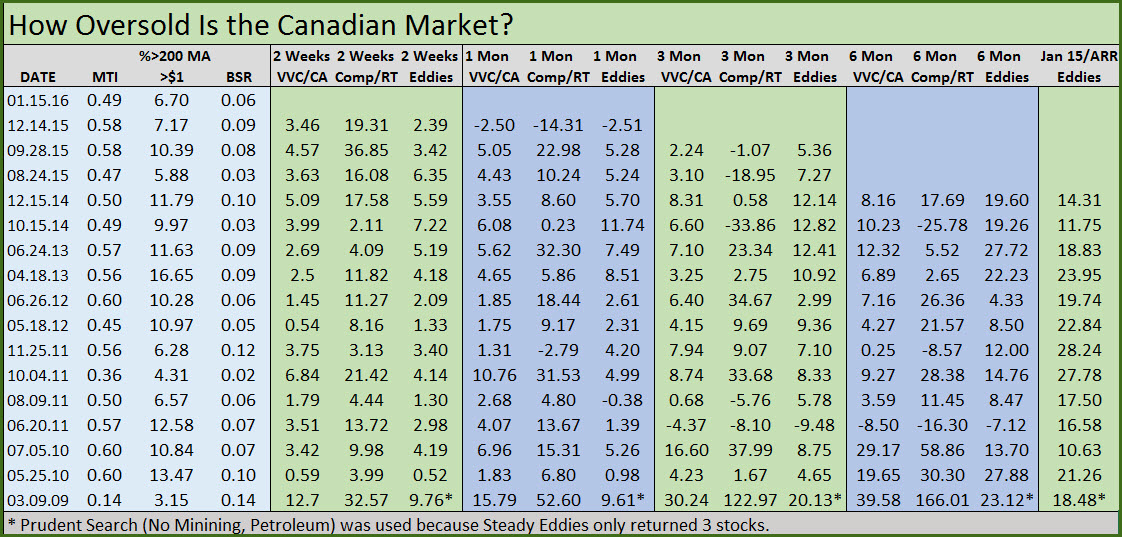
How Oversold Is Our Canadian Market? What can we learn from a historical study of oversold market conditions using the MTI at .60 and below as our trigger? I showed the following chart to attendees at our Tuesday, January 19 SOTW Q&A. Attendees said the chart gave them confidence in both bottom-fishing and buying relatively safe, conservative stocks closer to market bottoms. Clearly the study showed it was getting too late at market bottoms to go short or even to sell weak performers unless something had fundamentally changed with your analysis of the stock’s potential. They asked me if I would post the chart on our BLOG, so here it is. Here’s what the chart shows:
- any date when the MTI reached a low of .60 or lower
- how few stocks there were on a percent basis remained above their 200-DMA when the MTI fell to these low levels, and indication of the breadth of the bear market
- the BSR ratio, the number of Buy-rated stocks in VectorVest divided by the number Sell-rated stocks, another measure of the health of the market and oversold/overbought conditions
- performance from the market date over 2-week, 1 month, 3 months, 6 months and all the way to Jan 15 to show the ARR for Steady Eddies when buying near a bottom. VVC/CA is the overall market; Comp/RT is S&P TSX Composite/RT, one of the VV’s popular bottom-fishing searches/ and Eddies is the Steady Eddies search found in the Conservative Strategies folder (Note: I excluded Mining and Petroleum from Eddies due to their volatility and cyclical nature)
- I used a basket of 10 stocks with the searches
I hope this information is both interesting and helpful. Your comments will be appreciated as always.
P.S. Check out the chart of XEG. According to Michael Wuetherick’s ‘Energy Digger’ strategy set out in our Dec 5 Online Forum. We received a signal Thursday to start buying petroleum stocks when XEG’s price crossed above its 5-DMA if we got follow-through the next day, and we did! XEG rose more than 5% on Friday. Several petroleum stocks rose much more than that. You can still check out the Forum recording: CLICK HERE TO VIEW DEC 5 ONLINE FORUM REPLAY.
Presented by Stan Heller, Consultant, VectorVest Canada
DISCLAIMER: The information contained in this Blog is for education and information purposes only. Example trades must not be considered as recommendations. You should always do your own analysis and invest based on your own risk tolerance, investment style, goals and time horizon. There are risks involved in investing and only you know your financial situation, risk tolerance, financial goals and time horizon.


Amazing info Stan you always do so much to keep us informed and help us to be successful investors. The chart from Tuesdays Q&A was exceptional. Thx
Thanks Mike. I’m delighted you find the information useful. It was quite interesting putting the chart together!
Hi Stan,
Was going to try to do some variations on your gold digger strategy – but couldn’t find it in the videos list…. It seems to have become time expired, is there any way to recover some of the earlier videos from this year?
Hi Ryan, I think I’ll need to a new video on the Gold Digger strategy. Pretty much though if you just pull up a graph of the gold/silver industry group. If price is above the 40-day MA, it’s generally a good time to go bottom fishing with the Gold Digger search or your favourite gold and silver stocks. A variation for the more aggressive is to start legging in when price crosses above the 4-day MA on the industry graph. Hope this helps.