 If you’re someone who loves an interesting and humorously-told Fable, you don’t want to miss Friday’s Special Presentation. Like all Fables, the Story of Bart the Cherry-Picker gave us some valuable lessons delivered in a highly entertaining way. Just go to the VIEWS tab, Strategy of the Week and click on the link.
After you’ve watched the video, please join me tomorrow at 12:30 p.m. ET for our weekly SOTW Q&A webinar. We’ll answer your questions about the Top 5 cherry-picking techniques explained in the Fable, and we’ll look at current market conditions including stock winners and losers.
Here is the link to register: https://attendee.gotowebinar.com/rt/4093035754967328770
Our Canadian Market. The overall market as shown by the VVC/CA composite index finished down -.33% last week. The TSX (symbol PTSE in VectorVest) was down -.60% while the Venture (CDNX) managed a gain of .26%. The Colour Guard is somewhat bearish. Guidance provided in Friday’s Timing the Market video was emphatic, ‘Now is not the time to buy stocks”. We should wait until at least a Primary Wave Up (PW/Up) or a Green Light in the price column with follow-through before trickling back into buying stocks long.
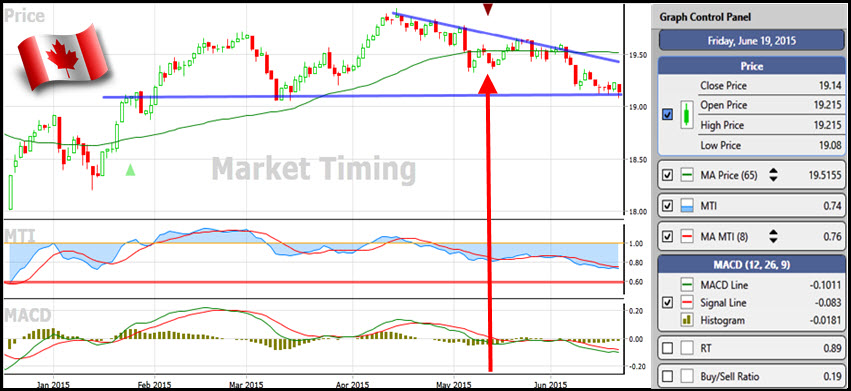
We’re nearing a market bottom. However, with the MTI down to 0.74 on our 0-2 scale, we’re nearing that ‘oversold’ or ‘market bottom’ territory that we’ve seen historically in our MTI graph. Senior Instructor Jerry D’Ambrosio noted a slightly bullish divergence in Friday’s Market Timing Report. Using the enhanced pro-trader market timing graph, we see that while the price of the VVC/CA continues to trend lower, the MACD histogram has actually started to move higher. So, it may be getting late in the day to take defensive positions except to sell stocks that have met our sell criteria. We should now be watchful for a potential rebound and have our WatchList of good buying candidates ready.
ADD MIDAS TOUCH STOCKS TO YOUR HOME PAGE. One of the Top Cherry Picking techniques is to use VectorVest’s Midas Touch WatchList. In response to subscriber requests, here is a short video that shows you step-by-step how to add the current day’s Midas Touch Stocks to your Home Page. Click here: http://www.screencast.com/t/n4yXuRgz3
NEW BUYS. Very telling about our market is that we had only 6 new buys Friday, and two of them were bearish ETFs, S&P Gold Bear (HGD) and S&P 60 Bear (HXD).
TOP GAINERS. Top weekly gainers to watch include Aveda Trns Energy (AVE) up 49%; Tribute Pharm (TRX) up 27%; Regal Lifestyle (RLC) up 25%; UrtheCast (UR) up 24%; and Tree Island (TSL) up 23%.
BIGGEST LOSERS. Biggest weekly losers included Delphi Energy (DEE) down 15%; Savanna Energy (SVY) down 15%; Kelso Technology (KLS) down 12%; Temple Hotels (TPH) down 11% and IBI Group (IBG) down 10%.
MTI (Market Timing Indicator) GRAPH. A few things to watch for next week in the MTI Graph:
- The market moved sideways and then lower after the C/Dn call was issued May 12. (brown triangle)
- The price channel is narrowing in the ‘wicked wedge’ (blue trend lines). As the wedge tightens, price is likely to break through the wedge to the upside or the downside.
- The MTI is still below its 8-day SMA but the lines are starting to come together.
- The MACD histogram has been rising since about June 9 from -0.030 to -0.018. So while it’s still negative, it is showing a bullish divergence with the current price action.


Excellent and very timely info thx
Thanks Mike. I think Brian’s presentation Friday is one of the best ever. Simple, entertaining and some valuable trading methods.
Hi Stan
Apparently the “extended hours” tool is not available for VV Canada. Only in America or at least this is what I was told when I called tech support yesterday.
Geoff
Hi Geoff, Yes, that is correct. This morning I sent a list of 180 Canada/US inter-listed stocks to our Database Manager. I’ve requested they be added to the Special WatchList folder in the US database as well as Canada. If that happens, perhaps we can use the Extend Hours to identify Canadian stocks that are trading up in the US pre-market.
Great Stan
You are always on the ball!!
Geoff