

“Everything begins with market direction.” That’s according to VectorVest Founder Dr. Bart DiLiddo in his classic investment book, “Stocks, Strategies and Common Sense.” It makes good sense then that the first step in your trading should always be to decide if you are bullish, bearish or neutral. After all, you need direction before you act. Let me repeat that. You need direction before you act. How many of us don’t do that?
Why is market direction or timing so important anyway? Well, let’s face it, fighting the trend is a quick recipe for losing money, no matter how profitable the company is that you are investing in. Conversely, just like the ricketiest boats in the harbor, even the weakest stocks can get a lift from a rising tide.
As far as market timing goes, the simplest, no brainer method is to rely on the Color Guard and our various Market Timing systems to give us our signals. There’s nothing wrong with that. The signals are reliable, and they range from fast to slow, aggressive to conservative, so there’s certain to be a signal that suits your investment style. That said, a little deeper independent analysis can provide us with valuable insights and an extra edge.
At our Lethbridge User Group meetings, market direction is the first topic on every agenda. It always generates wide-ranging discussion and a variety of analysis techniques before arriving at a consensus. I expect it’s the same at most User Group meetings. It certainly was for the Lake Geneva, WI User Group back in October 2008.
It’s the Lake Geneva User Group under the leadership of Jim Mahoney at the time that came up with “The Market Scorecard.” You’ll find a copy in the Views tab in VectorVest US under “Special Reports.” You can also read about it in the US Views on 10/31/2008 and you can see a live demonstration of how it works in an outstanding “Strategy of the Week” presentation in VectorVest University, also on 10/31/2008. Below are a few of my favourite things about the Scorecard.
First, Jim thought it was important to know, is the market trending up or down? Is the MTI below 1.00 or above 1.00? Is the BSR trending up or down? Which way is the VIX trending? The VIX is often called the Fear Index and it is considered a leading indicator, inverse to the S&P 500. So, if the VIX is heading up, the SPX is about to start moving down and vice versa. It’s an extremely valuable indicator, but often overlooked.
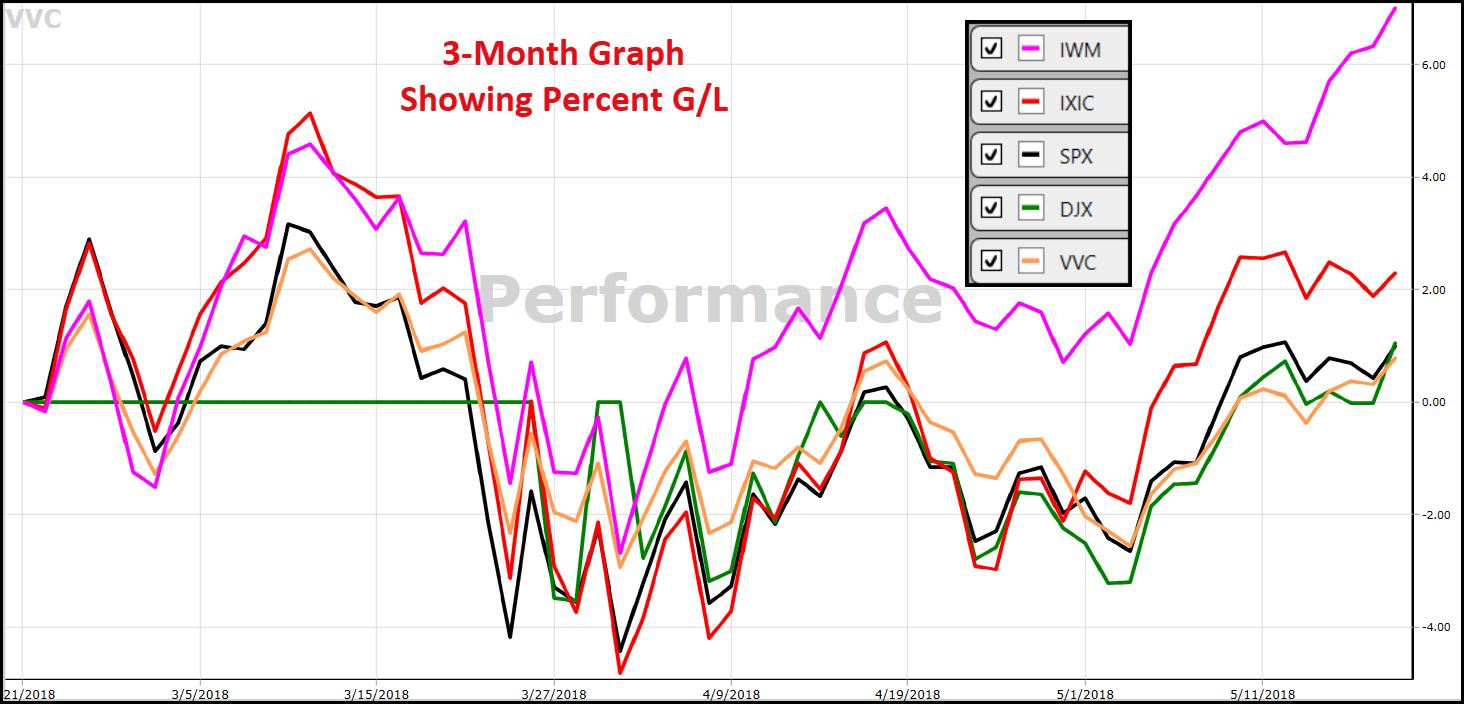
My next favourite thing that Jim recommended was to open the Performance Graph and study the trend of the major indices by inserting these symbols: SPX (S&P 500), DJX (Dow Jones), IXIC (NASDAQ Comp) and IWM (Russell 2000). The VVC is added by default. Once I have added the symbols and given them the colors I like, I save the Graph Layout with a title such as Major Indices. Now I can quickly compare the trends of the indices using different timeframes from 1-year down to 1-month. Since I have RealTime, I also like to look at two or three Intraday set-ups such as 30-minute bars over 5 days and 5-minute bars over 1 day. Which index is leading, and which index is lagging? If they’re all rising, we could be in for a continuation up move.
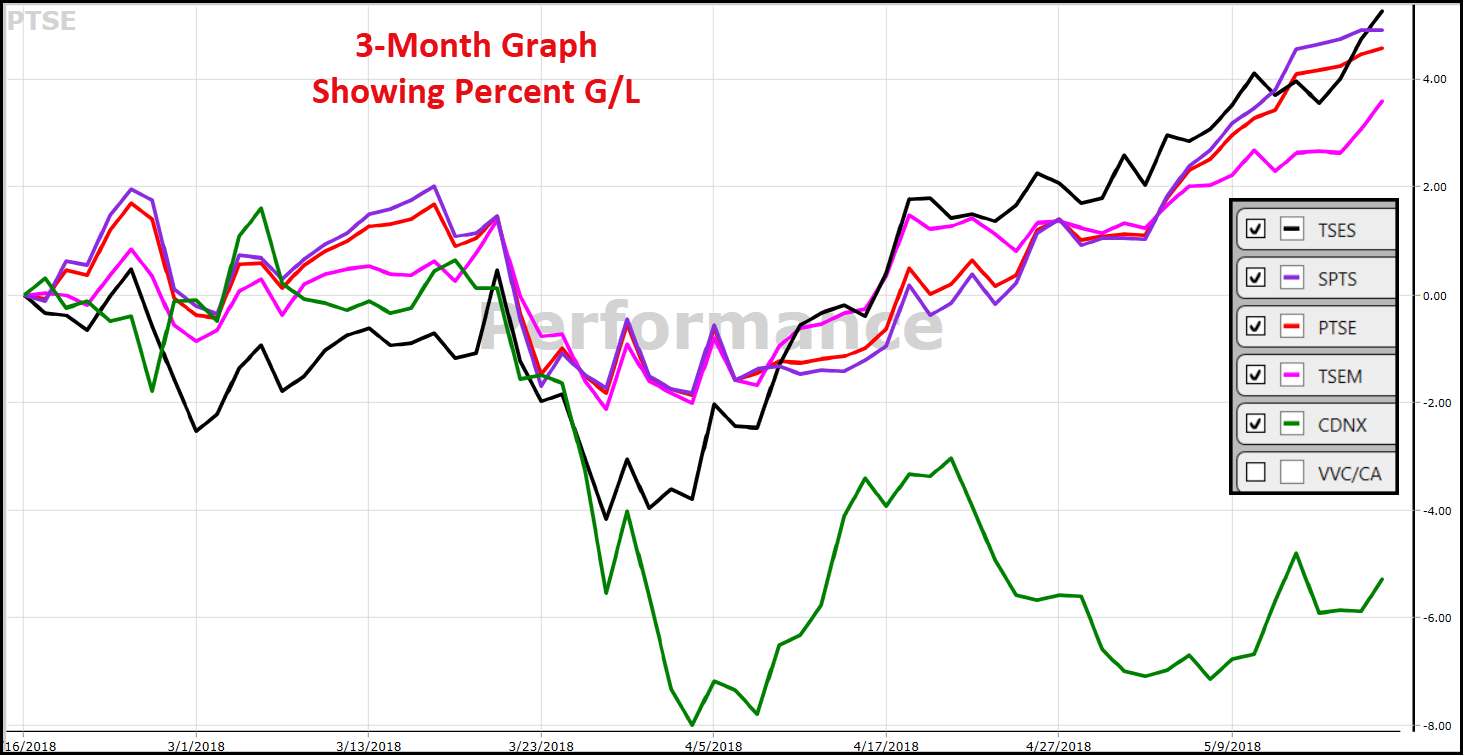
For the Canadian market, I use the following symbols to track the indices I am most interested in: PTSE (TSX Composite); CDNX (Venture); SPTS (TSX 60); TSEM (MidCaps); TSES (SmallCap); and, of course, the VVC/CA. Take a minute and plot these on a 1-month Performance Graph. As of Tuesday, May 15th, the SmallCap and TSX Composite are the places to be while we need to avoid Venture stocks like the plague for now. You’ll find the list of 205 stocks that make up the SmallCap index in the TSX WatchList folder. Same for the 249 stocks in the TSX Composite.
The Market Scorecard is a valuable tool. I suggest you print one out or copy and save it in a Word document, then complete it while listening to the 10/31/2008 SOTW. Once you get the hang of it, in 15 minutes or less, you’ll have done your homework having carefully considered all the essential information to decide if you are bullish, bearish or neutral. You’re not just guessing or following the crowd.
Let’s see how your score compares with mine for Canada this Tuesday evening. I am 69.23% Bullish with a 9 to 4 score. I have been filling a few holes in my retirement portfolio since just before the May 9th C/Up Call. Now I can continue with confidence, thanks to THE MARKET SCORECARD.


Performance graph is a life saver it change my trading style and provide peace of mind. again thank you