What is a period of calm and how can it help you identify a good trading opportunity? View the replay of Saturday’s VectorVest International Online Forum to discover the answers and other valuable trading tips by Petra Hess, Burlington, ON VectorVest User Group Leader. You’ll also get highlights of VectorVest’s weekly Global Market Review presented by Canadian Consultant Stan Heller, and where to find Hidden Wisdom in VectorVest’s Help files. Click here to watch the recording now!
Unfortunately, a planned Special Guest Appearance by renowned investor Warren Buffet on this Saturday, April 1 Forum did not come about apparently due to internet issues in Nebraska. However, Mr. Buffet did send over some of his favourite investing Quotes which we shared in the last slide of the presentation.
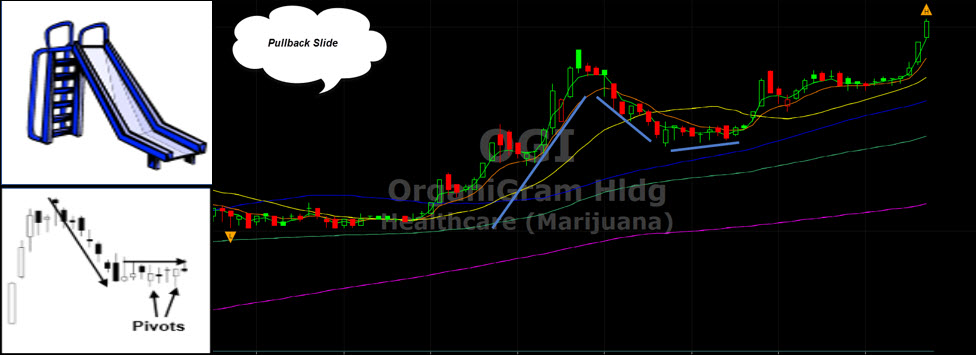
Saturday’s Forum delivered more valuable tips and ideas for making money with VectorVest. Petra Hess showed a few new easily identifiable chart set-ups for better entries and exits in her presentation titled, Value Zone Investing Part II. (See below for a link to a replay of last month’s Part I) I love the pattern Petra calls the ‘slide pullback’. It’s a high probability set-up, and so easy to spot. After a price swing up like the steps on an “old-fashioned slide’, price begins its decline, steeply at first, and then flattening out toward the bottom of the countertrend move. The ‘mild’ sideways move after the decline provides a clue that price may be done falling, Petra explained.
“The flattening out of a price represents a period of lower volatility which is often followed by another swing up,” Petra said. “This period of calm provides an opportunity to enter a long position before the crowd gets aboard and runs the stock back up again.” Below is a example of the chart set-up.
Petra describes her philosophy around this trading method as, “Enter while the market is mild and exit while the market is wild.” Her exit guidelines include exiting immediately when your initial stop is triggered; sell a languishing or non-performing trade, exit if your stock gap downs and exit if your stock price is slowly but consistently falling.
Thank you Petra! Once again Forum attendees chatted in their appreciation for Petra’s teachings.
“Another excellent presentation!” – Robert D.
“Fantastic! Thank you Petra for sharing your experience and knowledge.” – Alan B.
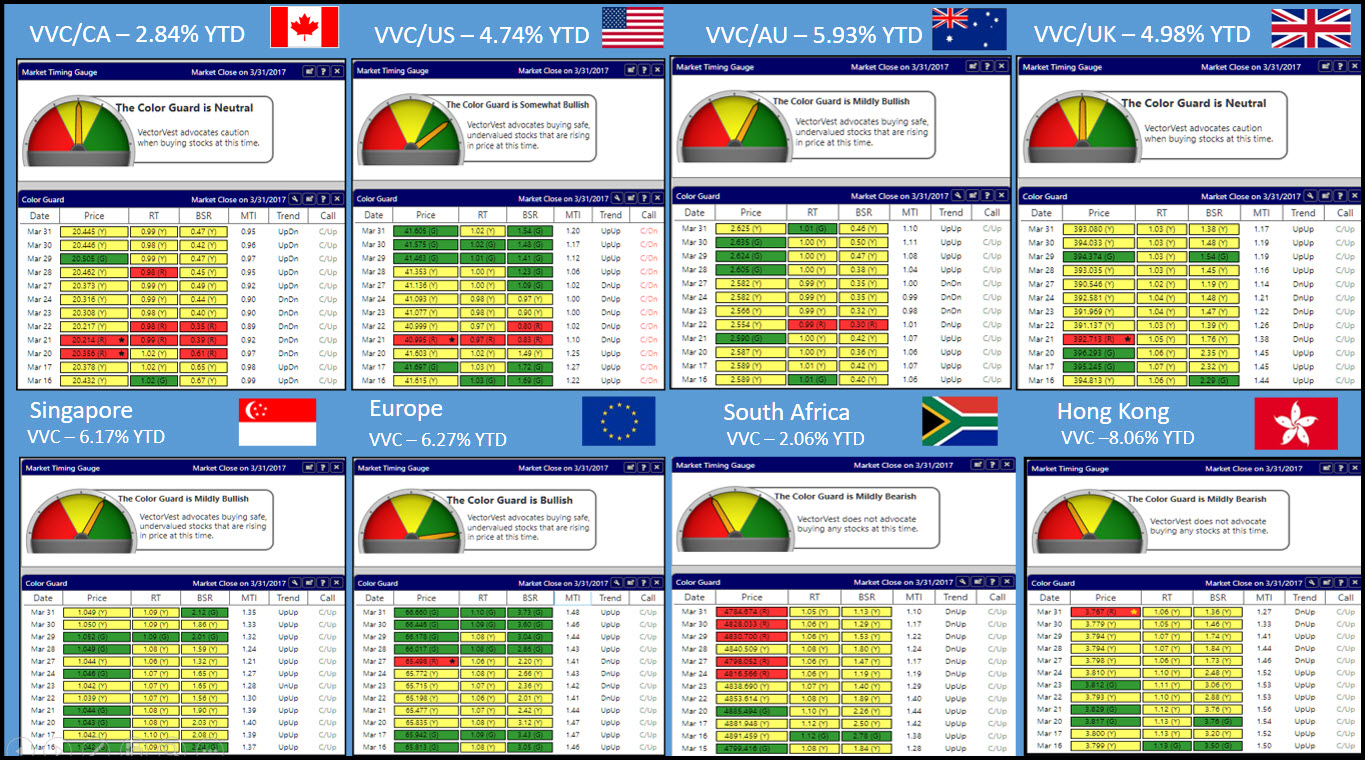
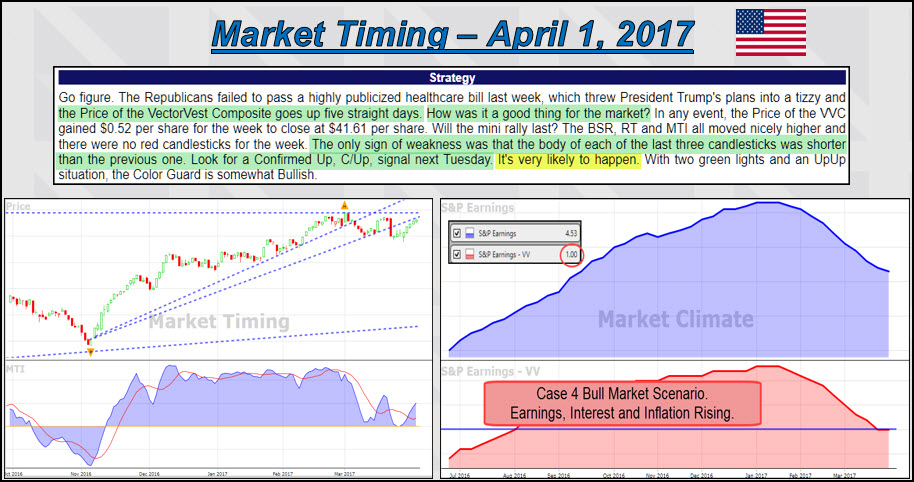
Market Review. Our review of VectorVest countries showed positive returns YTD (Year To Date) across the board. Hong Kong, Europe and Singapore have the highest YTD gains at 8.06%, 6.27% and 6.17% respectively. Currently only the US is in a Confirmed Down Call (C/Dn), and that could change as early as Tuesday if the current rally continues.
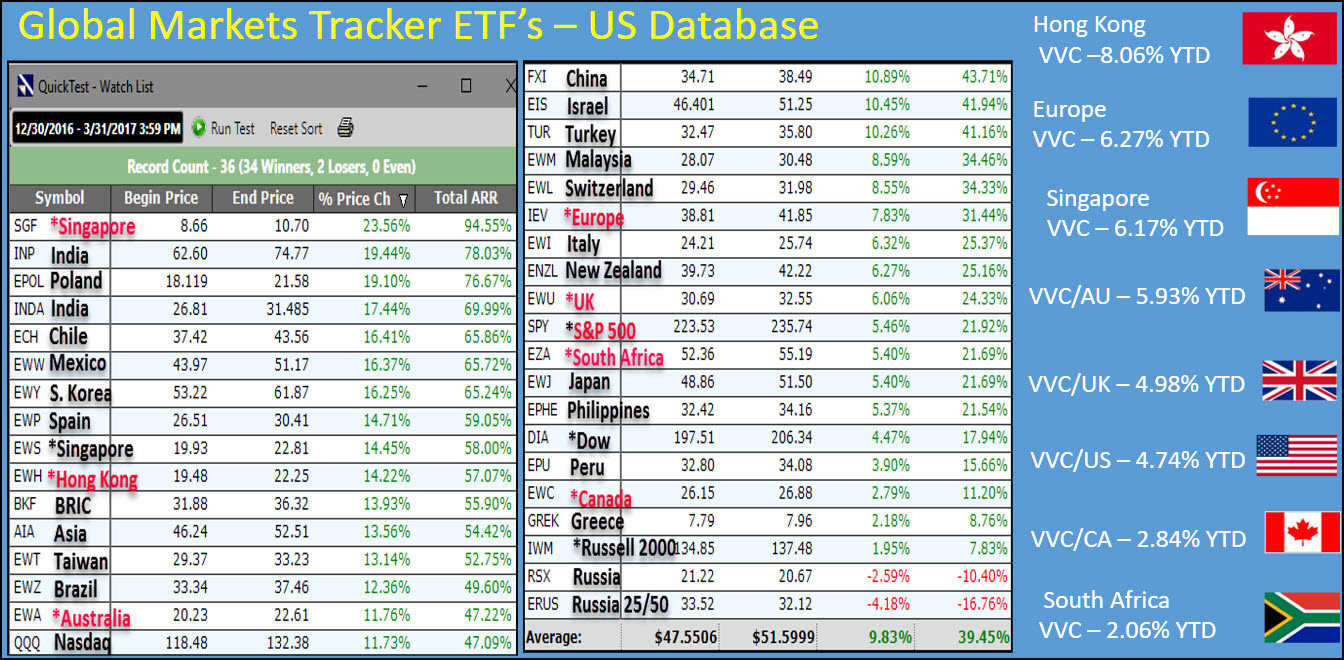
Set out below is a look at all the Color Guards in chart 1 as well as a Quicktest in chart 2 of several benchmark ETFs our Canadian VectorVest Consultant uses to track Global Markets in a WatchList. Stan Heller pointed out that several ETFs are outperforming their overall market as represented by the VectorVest Composite. All these ETFs are tradeable. “Definitely worth your time to create your own WatchList and study the graphs on a regular basis,” Stan says.
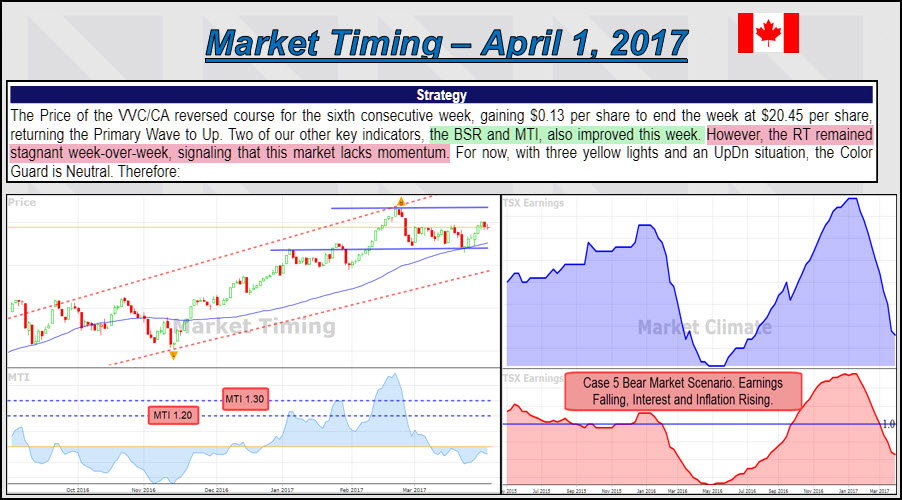
Canada and US Markets – What’s Happening? Stan also highlighted VectorVest’s weekly guidance on the CA and US markets as shown below. Three areas of concern in the CA market is #1: Failure of the VVC/CA price on the Market Timing graph to break out of a resistance zone; #2: a stagnant RT signaling the market lacks momentum; and #3: TSX Composite earnings falling, driving the market further into a Case 5 Bear Market Scenario. In the US, increasingly shorter candlesticks the last three days in the VVC Market Timing may be a sign of weakness. However, if price can break above the trendlines and resistance zone shown in the graph below, we could get a Confirmed Up signal next Tuesday. Keep your eye on the MTI and the daily Color Guard Reports to keep on the right side of the market. Two useful sites for futures information: www.finviz.com and www.investing.com.
Hidden Wisdom in VectorVest’s Help Files. Do you know how and why Founder Dr. Bart DiLiddo created VectorVest’s Stop-Prices? He wrote about it in an essay September 7, 2007 titled, Fatally Flawed. The essay, and several others containing gems of commonsense investing wisdom, are included in the BEST PRACTICES folder in VectorVest’s Help files.
TIP: In Fatally Flawed, Dr. DiLiddo concludes, “…you should know your exit Price even before you buy a stock. Without such a discipline, your trading process will be Fatally Flawed.”
In Saturday’s final presentation, Stan Heller showed how you can dive into the Training tab not only to get help with understanding and navigating the VectorVest program, but also where to find investing wisdom, tips and guidance. The five Successful Investing Videos. Best Practices. The Quick Reference Guide clearly showing guidelines for When to Buy, What to Buy and When to Sell. How Dr. DiLiddo uses the Stock Viewer to find great trades. How to use your 10 Votes for New Features you would like to see in VectorVest.
Here’s a TIP from the Quick Reference Guide on selecting stocks to buy: “If you look at a graph for more than a few seconds and you still aren’t sure whether you like it, move on to the next graph. You will find one that looks good.
You don’t want to miss out on the gold in the Training tab and Help files! Here’s what a few members chatted in when I asked if they have previously studied the Help files:
“No, this is new to me but it looks great.” – said Linda M. with similar comments by Barry K., Mike S., Jack H. and many others. “No, thanks for the suggestion,” said John M. “Great INFO,” said Sidney W. and “Super resource,” said Frans S.
 Not a VectorVest Subscriber? Take a 5-Week Trial for just $9.95 USD. Check out VectorVest’s analysis of the stocks you own and view the Successful Investing 5-part Video Series before you decide if VectorVest is right for you. Call 1-888-658-7638 to arrange your trial.
VectorVest defines Bull Market Scenarios as those that have a rising Earnings Trend Indicator (ETI) as recorded in our Truth Chart. As with many financial measures, however, there is an inside story hidden below the top line number. Join Mr. Todd Shaffer, Manager of Research, for the complete story in this week’s “Special Presentation” titled, “The Inside Story on this Bull Market.”
To View previous Online Forum video replays, click on the recording links below:
January 7, 2017 – Stock Chat hosted by Stan Heller, Consultant VectorVest Canada
December 3 – My Three Friends: Value, Price and Earnings by Mike Simonato, Ontario VV Member.
November 5 – Guide to Worry-free Investing with Dr. Bart DiLiddo
Posted by Stan Heller, Consultant, VectorVest Canada
DISCLAIMER: The information contained in this Blog is for education and information purposes only. Example trades must not be considered as recommendations. You should always do your own analysis and invest based on your own risk tolerance, investment style, goals and time horizon. There are risks involved in investing and only you know your financial situation, risk tolerance, financial goals and time horizon.


Leave A Comment