Hard to believe it, but another earnings season is already upon us. Why do investors care so much about earnings anyway? Well, as our Founder, Dr. Bart DiLiddo, writes in his little green book titled, “Stocks, Strategies & Common Sense,” “Earnings growth is the engine that drives stock prices higher and higher.” As with all matters investing, the opposite is also true.
What Investors Need to Know about Earnings
Few things can move a stock faster and farther, up or down, then an earnings announcement. Earnings means profit. A growing Earnings Per Share, EPS, is the most important indicator of a company’s financial health.
Before earnings reports come out, stock analysts issue earnings estimates, in other words, what they think earnings will come in at. These forecasts are then compiled into a “consensus earnings estimate.” When a company beats the estimate, it’s called an earnings “surprise” and the stock’s price usually moves higher, especially if the company also issues a positive outlook. The opposite is true. If a company releases earnings that falls short of the estimate, it is said to “disappoint.” Share price is almost certain to move lower until the company can right the ship or valuation looks attractive once again.
VectorVest provides four vital, exclusive measures of earnings. Paying close attention to them can help investors become more consistently profitable while reducing the risk of getting burned by an “earnings disappointment” on a stock they own.
First, consider owning high Relative Safety, RS, stocks. Stocks with RS scores above 1.20 on a 0.00-2.00 scale have proven, consistent and predictable earnings. Such stocks are more likely to have an earnings surprise than an earnings disappointment.
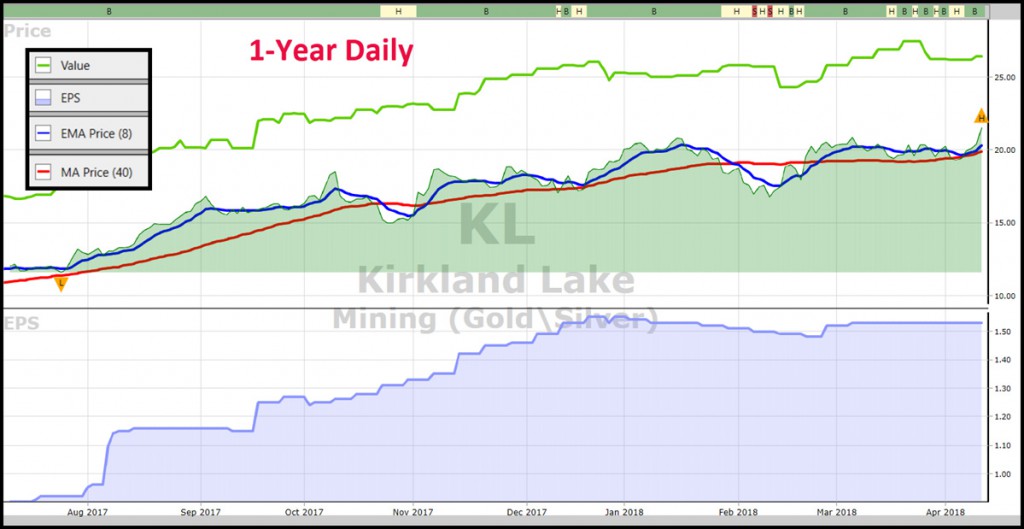
Second, look for EPS on a one-year graph to be rising from bottom left all the way to the right edge. EPS in VectorVest is a leading 12-month indicator of earnings. It is computed from a combination of recent earnings performance and traditional fiscal, calendar year earnings forecasts. The ability to see EPS on a graph gives VV investors a distinct advantage.
Third is Value. It’s computed from forecasted earnings per share, forecasted earnings growth, profitability, interest and inflation rates. How important is Value? Place Value on a graph of the Top 20 VST stocks. Here’s what I saw Tuesday afternoon. Price is generally rising, that’s how they got to be top VST stocks. More important, 16 of the 20 stocks are undervalued, and in most cases, Value was persistently rising. Kirkland Lake, KL, is a great example of the power of Value. While all but five stocks in the TSX Global Gold Index have fallen in price this past year, KL is up about 92%. Notice how KL is undervalued and Value has been tracking higher and higher the entire year.
Finally, a fourth key measure is Earnings Growth, GRT. In VectorVest, GRT reflects a company’s one to three-year forecasted earnings growth rate in percent per year. It’s so important, Dr. DiLiddo devotes the entire Chapter 5 of “Stocks, Strategies and Common Sense” to the topic. It’s a great read. He titled it, “Earnings Growth: The Golden Touch.” He writes, “The earnings growth rate of your stocks must be consistent with your investment objectives. If you want to double your money every five years, you should have a portfolio of solid stocks growing at least 14 percent per year.”
So, use VectorVest’s measures of earnings to help you with What to Buy, When to Buy and When to Sell. Be aware of upcoming earnings dates and “consensus earnings estimates,” especially for stocks you own, or you might wish to buy. TMX Money has an excellent earnings calendar and I’m sure there are others.
Finally, you may wish to go back and review my essay of 11/10/2017. It’s titled, “6 Strategies to Reduce Risk and Profit During Earnings Season.” I’m certain it will be worth your time, because whether you’re a company or an investor, IT’S ALL ABOUT EARNINGS.
Want to find stocks with great earnings potential? Try a VectorVest 30-day trial today, only $9.95!


Leave A Comment