

Dividend Yield (DY) is primarily viewed as an estimate of how much income you can expect to receive in relation to the price of the stock if you hold it for an entire year. The formula is simply the Annual Dividend Paid divided by the current Share Price, or the Purchase Price if you already own the stock.
However, yield is also effective as a measure of valuation and a measure of risk. After this major selloff, retail and institutional investors will be looking for quality dividend stocks at bargain prices. Here’s how you can use Dividend Yield to find them and improve your entries and exits.
First, you need to understand there is an inverse relationship between yield and valuation. That is, as a stock’s price moves lower, DY moves higher and vice versa. High yield signals low valuation. Low valuation and high yield attract buyers.
The opposite is also true. Low yield signals high valuation. Investors sell when valuation is high and price is losing momentum. This cycle between low and high valuation repeats.
Here’s the juicy part – buying at low valuation is historically associated with higher returns. It’s what successful investors look for – getting into a good stock at a lower price and then selling higher.
Now, keep in mind, some stocks are cheap and getting cheaper for a reason. This is where dividend yield plays a role as an INDICATOR OF RISK. An unrealistically high yield may signal risk about the company’s ability to continue paying the dividend.
That’s why VectorVest’s proprietary indicators are essential to complete your analysis. You want to favour companies that have consistent and predictable earnings. In other words, stocks that have a RS (Relative Safety) above 1.0 on a 0.00 – 2.00 scale or close to it. Dividend Safety (DS) and Dividend Growth (DG) should be at acceptable levels. You should demand a DS of at least 40 on VectorVest’s scale of 0-99 and DG well above inflation, 8% or so as a minimum.
WHEN TO GET IN?
When DY has stopped falling and price begins rising, you should be ready to pounce if you have room in your portfolio. You can wait for a new BUY rating, never a bad idea, but the goal is to get in as early as possible near low valuation, just as a new uptrend is starting.
How do you know when valuation is low and a buying opportunity is near? Price rising from recent lows and DY falling from recent highs is one way. For analysis, we can use moving averages on DY for the same reason we use moving averages to smooth out price action. Yes, in VectorVest we can apply moving averages to most indicators, including DY.
Try this. On your graphs, add the DY Parameter to your graph menu. Leave it unchecked. From there, create two simple moving averages of DY – the 3-MA and 40-MA. Change the style of the 3 to red, and the 40 to green. Why? Remember, opposite to moving averages of price, we want to buy when the longer MA of DY, the 40, is ABOVE the shorter MA of DY, the 3. Save the graph layout when you’re done.
It’s remarkable how often when the 40-MA crosses above the 3-MA, price starts to rise after low valuation. Try it yourself on dividend payers that you own or have owned, and any WatchList of solid dividend payers such as the Master Retirement WatchList or WOW Dividends. Go back one and even two years on a daily graph.
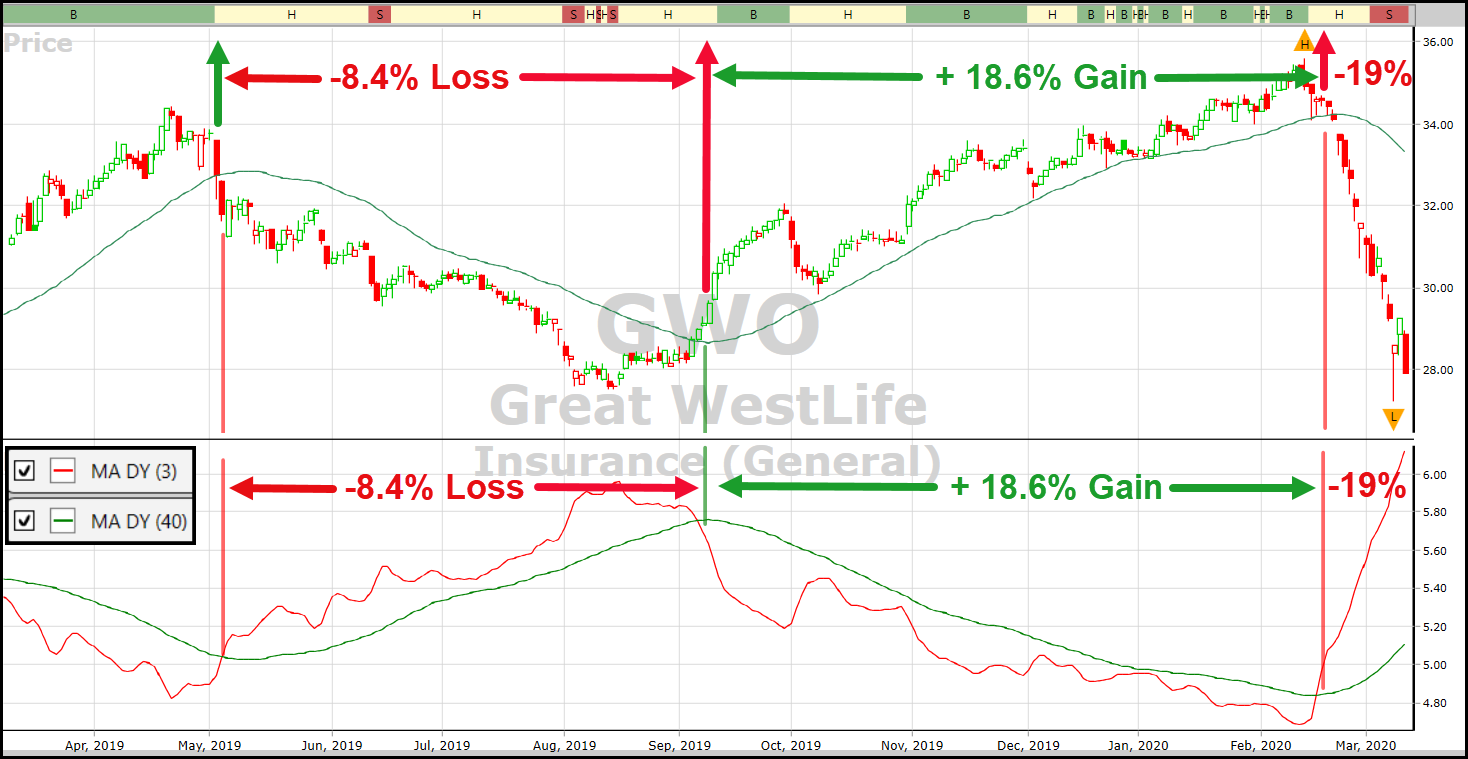
Click or tap image to enlarge.
If have ProTrader as a RealTime subscriber or if you purchased it separately, use the Custom Field Builder to create the custom moving averages on DY. This will allow you to run searches to find the crossovers as soon as they occur.
As a further resource, please read again my essay of January 18, 2019. I set out a simple little search that among other things required DY>=4; DS>-40; and DG>=8. With such high yields, I was pretty sure that any stocks returned by the search would have low valuations – a buying opportunity. As of February 21, 2020, the ten stocks highlighted in the essay had gained 27.58%, not including about 5% in dividends. This handily outperformed the TSX which gained 16.6% over the same period. That’s the benefit of knowing how to use DIVIDEND YIELD AS A MEASURE OF VALUATION AND RISK.


Leave A Comment