

Sometimes this market is hard to figure out. As I write on Tuesday, January 28, the Market Timing Indicator or MTI continued to fall even on a day when the TSX Composite rose 58 points or 0.33%. The Buy/Sell Ratio or BSR fell 0.28 points Monday and 0.03 points again Tuesday, giving us a second red light in the BSR column. This is an indication the health of the broad market is weakening.
Furthermore, the Primary Wave, our fastest timing signal, is down, displayed as PW/Dn in the Color Guard’s Trend column. Taken altogether, “VectorVest does not advocate buying any stocks at this time.” Prudent investors should wait at least until we get a PW/Up signal in the Trend column before buying stocks long.
Your goal is to make money and make it consistently. That means not going against the market trend and not buying stocks that are falling in price. It also means selling when your stock is falling and falling some more.
It helps if you have a guide. That’s why VectorVest assigns a Buy, Hold or Sell rating to every stock, every day. When the Color Guard is Bullish, Mildly Bullish or Somewhat Bullish, and the guidance says it’s okay to Buy stocks, Prudent Investors may selectively buy high VST-Vector, “B” or Buy-rated stocks. Aggressive Investors might look for fast moving, high momentum stocks with rising RT values. They may or may not be “B” Rated.
Here is how investors should interpret our Buy, Hold and Sell ratings. The BUY-rating means the stock is trending higher and has at least a minimum of acceptable fundamentals. It is therefore suitable for purchase. To get a BUY, the stock’s Price must be above VectorVest’s assigned STOP Price; RT must be greater than 1.0; VST must be greater than 1.0 (that’s where the fundamentals come in); and Price must be “pulling up and away” from its STOP Price. Four rules. No guesswork. No emotion. Just hard and fast rules.
And, this is important. The best time to step in and buy is when the rating is shifting from Hold to Buy or Sell to Buy. There’s a search in VectorVest to help you find these newbies. It’s called, New Buy Rated Stocks and it’s in the Trends – New Stuff folder. Study the graphs of these New Buys and look for patterns, breakouts on high volume and consistent performance.
When a stock gets a SELL, it’s time to get out of the stock. Price has fallen below its STOP-Price, a 13-week moving average of price adjusted for the fundamentals of the stock. That’s the only rule. Either the market trend is dragging the stock down or something else has gone fundamentally wrong such as bad news, bad earnings, overvalued or profit-taking gone amuck. There is a saying, “Your first loss is your best loss.” In other words, there’s no point waiting to see if price is at a bottom or hoping it will soon find support and then move back up. “Hope” is not a tool for effective and profitable investing.
The HOLD rating means don’t buy if you don’t own it and don’t sell if you do. The stock is above its STOP price but at least one of the other three rules for a BUY has not been met.
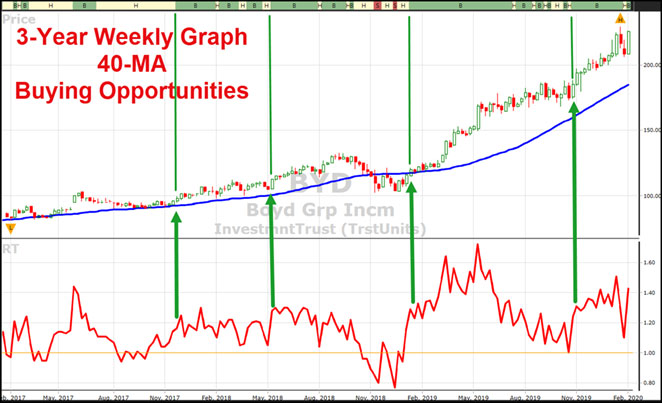
Click or tap image to enlarge.
YOUR WEEKEND ASSIGNMENT
Study 100 or more top RS, VST and CI stocks on a 3-Year Weekly Graph. Notice the B, H and S ratings at the top of the graph. Look for stocks that have few SELL ratings and put your cursor on the NEW BUY signals when the 40-MA is flat or trending up. Ask yourself, “Could I have made money before selling?” At the end of the exercise, I am certain you will better understand when TO BUY OR NOT TO BUY.


Leave A Comment