submitted by Irwin and Karyle Blank
Allan Kissner, our user group Chair, called the meeting to order at 1:05 PM and asked all the attendees to introduce themselves. The agenda for the meeting was referenced and no additional items were suggested for the agenda. Allan took a few minutes to review the VectorVest strategies of the weeks for the October 10th to November 21st period. Allan highlighted a webinar that Stan Heller had hosted recently on “Developing a Winning Trading Plan”, and recommended it to all user group members as an excellent seminar describing the importance of developing a trading plan. Allan noted that this November 20, 2014 webinar is currently saved as a recording that can be accessed through the Canadian VectorVest Views tab for Friday, November 14, 2014.
Allan asked if it remained worthwhile for him to photocopy all of the notes. A number of the group members expressed their appreciation for him doing this for us. As a follow up for consideration, given that the group has a tendency to focus on a single webinar identified by Allan as the best one, it may be more effective for Allan to provide copies of the single webinar he has identified as the most relevant to the group and spend more time at the meeting focusing on that top webinar.
Question from one of the user group members: Why isn’t there a single best strategy that works almost all the time instead of what seems like 100’s of different strategies?
Responses:
• The market situation impacts the strategy. For example, strategies that work in a bull market are not the same as the ones that work best in a bear market.
• VectorVest provides multiple strategies to fit the specific conditions of the market, which is always changing. One positive benefit is that the top five daily and weekly strategies are identified by VectorVest in the Views every Friday.
• The group chair gave a recent example noting that he had identified ten gold stocks using the Gold Digger strategy earlier this week and placed an order for these ten stocks. He cherry picks his stocks using the Stochastics indicator to assist him in determining his selections and his buy point. Note: The process he follows is described in more detail later in these meeting notes.
• The ideal strategy for an individual is dependent on what type of investor you are. The first step in identifying the best strategy(ies) for you is to determine if you are an investor, speculator, trader or gambler (just in it for the excitement). Using the VectorVest vernacular the investment categories are conservative, prudent, aggressive and speculative. Strategies that are optimum for someone with a long term investment perspective who expects to hold most investments for months or years (conservative, retirement, prudent UniSearch categories) are not the same as the ideal strategy for someone who is a speculator or trader who expects to hold their investment for days or weeks on average. VectorVest provides strategies for each type of investment personality.
Review of the October 4, 2014 Meeting Notes
As of October 4th the most conservative of the VectorVest market indicators used by our group (the two and thirteen week moving averages of the stop prices for the overall Canadian and US markets) had just turned bearish. In spite of those negative market momentum indicators the market climate for both the Canadian and US markets were in Case One and Case Four bull markets, respectively, as of October 3rd. Given this backdrop, the discussion at the October 3rd meeting focused on when, rather than if, the markets were going to turn back up again over the next few weeks.
The consensus of the more experienced traders in the group at the October 4th meeting was that they would hold off on making any new purchases until a positive market timing signal was received. Examples of potential triggers that were mentioned included Primary Wave, Green Light, DEW or overall market Stochastics moving above 20 with the %K above the %D indicator.
The question about trading strategies for an investor seeking to purchase dividend growth stocks today that would “provide an income yield of approximately 7% that grows with inflation, by the time the investor retired in five to seven years” was highlighted. Two search strategies suggested by Ron R. and Stan H. that could meet this objective were outlined in the October 4th meeting notes. Copies of those two strategies are included in the October 4th notes and available from the recording secretary on request.
The October 4th meeting marked the start of the Regina VectorVest User Group stock picking contest. The specific stock picks for each contest participant, along with the rationale behind the selections, were highlighted in the meeting notes. A copy of those original portfolios follows later in these notes.
What is VectorVest Telling Us about the Canadian and US Markets?
Canadian market:
The Canadian market is still in a confirmed down situation as of November 21st, with the two and thirteen week moving average of the market stop prices also continuing to be negative. With that said, all the shorter term indicators have turned positive in the last three weeks with primary wave, green light and DEW indicators all positive currently, and with a predominance of green and yellow indictors on the VectorVest Colorguard for the last 15 trading days. The MTI indicator for the Canadian market remains below 1.0 however (at 0.95), which is the only market timing indicator that is holding back a Confirmed Up call for the Canadian market. Indications are that it is a good time to buy stocks provided the market is rising on the day of purchase.
It is important to note that both the RT and BSR indicators are also below 1.0, however those indicators are not as heavily weighted in the Canadian market relative to the US market, due to the excessive impact of the junior oil and gas and mining sectors on the overall Canadian VectorVest composite index.
One of the group members asked about a specific stock they were trading, Precision Drilling, and asked to see the stock graph for that particular stock so that they could seek the group’s opinion on whether it was a good time to be buying that stock. The member also mentioned that from their perspective, it seems like the “green light” up days are not the best time to buy as their experience is that the market will often go down the next day after a green light. In response the group reviewed the stock graph for the suggested stock and identified that this particular stock appeared to be moving out of a channel trading pattern on the upside in the last few days and may be well positioned for accumulation now.
In response to the comment regarding it being better to buy after a down day than an up day, a number of the group members respectfully disagreed stating that this pattern may show up in specific individual stocks, after the fact, however it is always risky to buy when a stock is currently in a down trend as you have no assurance about the extent of the downtrend until a turning point is reached with some sort of positive up signal being indicated to confirm a reversal.
Follow-up post meeting comment: Since VectorVest introduced Intraday and Realtime applications a few years ago, they have advised that the ideal time to make a purchase identified on the previous night is the next day after the market has been open for 30 to 90 minutes (after 10 AM eastern time) so that the investor can confirm that the overall market and the stock are moving favorably that day prior to implementing the trade.
One of the new members asked about the use of VectorVest for intraday stock moves. The group spent a few minutes looking at the minute by minute charts for the market and for individual stocks using VectorVest Intra-day. One of our members mentioned he had some experience in day trading using these minute by minute patterns, however he did not do this type of trading presently.
A reference was made to a comment from a recent seminar put on by Larry Berman of BNN fame, where he made a point of emphasizing the concept that “you don’t buy stocks, you rent them”, as a necessary mentality for technical, short term or day trading techniques.
In response to a question about how the moving average feature works in VectorVest, the facilitator explained that any moving averages or moving average crossovers set up within the graphing function are always based on units of measure that are relative to the selected graph time frame. For example, if you set up a two and thirteen week simple moving average and save it as a retrievable graph, that same graph will become a two and thirteen day moving average if you are on an end of day time period or a two and thirteen minute graph if you are on an intra-day time period.
One of the group members asked for a refresher on how the Stochastics indicator can be used to identify market or stock turning points. Our group Chair noted that when the %K indicator was higher than the % D indicator and the indicators had just moved from below to above 20 and are on the rise, it was a good time to buy, as the market was moving out of an oversold situation. You can continue to buy/hold while Stochastics rises until the point when the Stochastics turns down or gets above 90. If above 90 (in overbought territory), don’t buy. Conversely, if the overall rating of a market or stock is dropping from a point above 80 with the %K below the %D, you should take the crossover below the 80 threshold as a sell signal.
The group used a graph called Stan’s MTI Indicator plus Stochastics to walk through the process of identifying how Stochastics can provide early indications of the time to get into (or out of) the market. When the market turned upwards in October the Stochastics indicator (rising above 20 with %K greater than %D) was the first of the timing signals to indicate the market trend change, ahead of the MACD, Primary Wave, Green Light, etc.
The group took some time to review each of the VectorVest market timing indicators from Primary Wave, Green Light and DEW, to Confirmed Up. A recommended stock purchase timing strategy provided by our group Chair for a “trading account” was to buy on the first Primary Wave signal after a down market and sell on the DEW down signal.
One group member asked about whether any group members purchased stocks immediately after they went ex-dividend. None of the group members followed this practice. One of the group members took a minute to explain that the stock movement after a stock went ex-dividend was highly correlated to the amount of dividend payment that was committed to the stock owners on the ex-dividend date.
US Market Trend:
The US market Colorguard indicator has a more diverse mix of green, yellow and red indicators over the last three weeks than the Canadian market, however the US market is stronger overall, as it is currently in a Confirmed Up status, which it has been in since November 12th.
Both the US and Canadian markets remain bearish according to the group’s longest term market indicator, the two and thirteen week moving average of the market stop prices, however even this long term indicator may change to positive for both markets if they continue to move upward in the next one to two weeks. The only questionable component for the US market indicators is the RT rating which has remained slightly below 1.0 and remains in “yellow light” status on the Colorguard.
Regina User Group Portfolios Update
Over the last 22 months since the Regina VectorVest group has been established, the group has identified six separate stock portfolios that the group has tracked since inception. The first of those six portfolios, the January 2013 Dividend Payers portfolio, has now been liquidated, therefore we will no longer be tracking that portfolio going forward.
The 2013 Canadian stock market User Group portfolio was selected based on the top recommendations of the Regina User Group members at our May 2013 meeting. Since its inception on May 24th the portfolio has gained 16%, not including the average 3.2% dividend yield of the portfolio. The overall Canadian market has gained 16.9% over the same period, which means that the User Group portfolio has trailed the overall market by 0.9% in the last 16 months. With the inclusion of dividends the all-in return from this portfolio remains slightly above the overall Canadian market return for the same period. All stocks selected on May 24th have been held to the present with no stop losses being employed. Note: This portfolio’s return is down by 4.9% since September 6, 2014.
The US stock market portfolio was selected based on the top recommendations of the Regina User Group members at our June 15, 2013 meeting. Since the purchase date of June 17, 2013 to present the user group portfolio has gained 26%, excluding the 1.8% portfolio average dividend yield. This compares with the overall US market that has increased 16.7% over the same time period, which means the Regina group US portfolio has beat the overall market by 9.3% over the last 15 months. No stop loss criterion has been applied, with all the original holdings still in the portfolio. Note: This return is approximately the same as the level it was at on September 6, 2014.
Two Canadian portfolios created by our group chair late last year have done very well since their inception.
• KTL 2014 is up 21.7% since its December 30, 2013 open versus the overall market up 10.1% over the same period (+11.6% for KTL). This portfolio is back to its peak return level for the year.
• The slightly more resource oriented AK 2014 is up 15.7% since its December 24, 2013 open versus the overall market, which is up 10.6% over the same period (+5.1% for AK).
• Our group chair noted that he had purchased the stocks in these portfolios, however he has sold out of all the holdings over the last 10 months, leaving him with gains somewhat less than the current levels.
Note: Due to time constraints the group skipped over the regular update for the US Portfolios. For the group’s convenience an update on the status of each portfolio has been included below.
One additional US stock portfolio focused on dividends has had a significant drawdown since September, but remains above the overall market performance since its inception.
• The US dividend growth portfolio, named Dividend Plays Plus 2014, has returned 7.6% since inception on December 27, 2013 (excluding its 3.6% portfolio average dividend yield), as compared to the overall US market increase of 4% (DPP2014 is +3.6% versus the market). This portfolio return has decreased by 12% from its high point earlier this summer.
• At the July 26th User Group meeting the group members selected two new User Group Portfolios, one for the Canadian and one for the US markets. These portfolios were based on the top two stock picks given by each of the meeting attendees at that July meeting. The specific stock selections for each portfolio were noted in the July 26th meeting notes. The first three months have been difficult for both of these portfolios with both underperforming their respective overall market averages.
o The July 26, 2014 Canadian stock portfolio is down 14% since inception, compared to the overall market which is down 1.2% (portfolio down -12.8% relative to the market). This portfolio has dropped 12.7% since September 6th.
o The July 26, 2014 US stock portfolio is down 1.9% since inception, compared to the overall US market which is up 0.1% (portfolio is down 2% relative to the market). This portfolio has dropped by 3% since September 6, 2014, but the returns have begun to improve relative to the overall market over the last four weeks.
In discussing the general returns from our user group portfolios, one key learning from observing these buy and hold portfolios is the importance of controlling losses using some sort of disciplined stop loss strategy. A number of the portfolios have suffered from individual stock price drops greater than 40%. This sort of loss creates a serious drag on overall portfolio returns that could be eliminated by something as simple as a 10% stop loss. The group discussed the importance of establishing a clear stop loss strategy and setting up a notification to indicate that a security you own may have breached a stop loss. There was considerable discussion about the importance of not posting your stop loss with your broker until after it is triggered to avoid being stopped out unnecessarily by a “stop loss seeker” only to see the stock rocket upward after your intraday stop out.
One of the group members took the opportunity to mention a book he had just completed, titled “What I Learned Losing a Million Dollars”, by Jim Paul and Brendan Moynihan. The book detailed the life of a very successful market trader whose long string of successful transactions had him thinking he was smarter than the market and most other traders. The individual ended up losing his entire net worth through a series of mental errors. Following this huge loss, the trader decided to study what made the most successful long term investors able to retain and continue to build on their gains over years and decades. He discovered that their methods for investing were all over the map (fundamental analysis, trend following, swing trading, technical analysis, etc.) with some approaches being contradictory to other approaches. In other words, the secret of their success was not on the buy side. The one thing all these long term successful investors had in common was a disciplined process to identify when their trades were going against them and when to exit a trade. They all had a disciplined, documented “sell side” strategy.
The key takeaways from this study explained in the book are:
• Never personalize a stock or investment. You need to remain able to accept and take a loss as a normal part of the investment process.
• Know what type of investor you are and ensure your investments are in alignment with your investment type (categories ranged from long term investor, to speculator, trader and gambler, who is in it for the fun and excitement). For example, don’t purchase an investment as a shorter term trader and decide it is now going to be a long term hold (investment) simply because you do not want to take a loss.
• Know what you are willing to lose prior to purchasing an investment and stick to that amount.
• Establish a (trading) plan to guide entry, exit and stop losses. Write down these rules as “if-then scenarios”. Establish them as a checklist followed every time you invest and follow the check list with discipline. Do not let your emotions override the written plan.
• When considering your current holdings, if you would not buy the investment today in current circumstances it is time to take gains or cut losses and sell that holding.
Our group chair used the opportunity to discuss the regular VectorVest training sessions on establishing a trading plan, which follows the same principles noted above. The November 20th webinar put on by Stan Heller, discussed earlier in the meeting, was mentioned again as an excellent one for learning the steps in establishing an investment trading plan.
Some of the newer group members asked about how the original group portfolios were established, which led to a discussion on using high VST stocks identified/cherry picked from the stock viewer after considering the stock’s price and value, which had been the foundation behind a number of the portfolios (AK and KTL in particular). The group also discussed the timing of those portfolio purchases, with emphasis on the portfolios established at or near the day after the last tax loss selling day of the year. This initial purchase timing strategy had been based on positive results from this timing methodology in previous year back tests.
The group members noted that purchasing stocks that have the highest VST in the Stock Viewer is a form of momentum trading. These are stocks that typically have very good fundamentals that are also market favorites at present. In these instances your trading strategy must remain sensitive to when the momentum for these stocks fades or reverses.
Over the next few minutes, the group experimented with a number of high VST picks on a month by month basis (buy at beginning of month and sell at the end, then repeat) with varied success from month to month.
One of the group members, DH, was encouraged to try a number of permutations of this systematic purchase and sale of high VST stocks philosophy and report back to the group on his findings at the December meeting (buy and sell top ten or top five stocks on strict time frames, buy selected high VST stocks and sell when they have either of a 10% gain or a 10% loss, etc.).
The group also discussed a number of hedging techniques for use if you do not want to trigger capital gains by selling current holdings, but you want to protect your downside risk. Alternatives suggested in this case include contra-ETFs (leveraged or non-leveraged) and option strategies. Option strategies work best in situations where you only have a small part of your total portfolio to use to purchase this downside risk insurance, due to their high leverage.
If capital gains are not an issue, the idea of selling a portion of your holding at a certain profit point while continuing to hold the balance, as a way of realizing some of your gains and mitigating your risk, while maintaining the opportunity for future gains, was recommended.
One of the newer group members asked if VectorVest would allow you to automate a buy or sell routine using the Stochastics indicator. The response was yes, however it was noted that an individual must have the ProTrader module, either purchased separately or received through an annual Realtime subscription, in order to set up and use automated searches and trading using Stochastics.
Regina User Group 2014 Stock Selection Contest Portfolios
The following is a description of each of the Regina User Group contest portfolios entered into our user group stock picking contest. The stock picking contest started at the October 4th meeting and will end at our December 13th meeting. Details of the contest were provided with the notes for the October 4th meeting. Copies are available on request. Winning contest participants will be judged strictly on the overall portfolio percentage gain over the contest period with no allowance for currency exchange rates or dividends paid during the period.
Contest participants had the right to sell up to two of their original selections and replace them with two others up to the November meeting date. Portfolio returns for each participant plus any portfolio changes requested by the participants are noted in the chart that following the portfolio descriptions.
Michael L’s Canadian stock picks were DHX, CP, L, MRU and FTS. These are stocks with high VST ratings, DY above 0 and a “Buy” recommendation as of October 3, 2014.
Ron W’s selections are as follows: Canadian Market – RRX, THO, TOG, BNK, SMF. These are stocks picked using a bottom fishing strategy that emphasizes stocks with very high relative value and low relative timing currently (i.e. these are stocks with pretty solid fundamentals that have been severely beaten up in the recent market downturn). Ron’s strategy is based on a “go big or go home” philosophy.
Roy F’s selections were a combination of the Canadian and US markets: Canadian selections – MX, TD, SCL, WCP with a fifth US stock selection of MU. These stocks were long term favorites of Roy picked based on stocks with strong fundamentals that had pulled back in price selected using an RV/RT criteria.
Kent C’s selections were all US stocks: GILD, LUV, MU, PANW, FB – Kent used the VST Rockets strategy to determine his selections.
Milt W’s picks: Milt chose a Canadian stock portfolio of companies he has had a long term interest in. One of his primary selection criteria is that the current price of each stock is substantially less than their current value. His picks were CNR, MFC, STN, SNC and LTS.
Bill M’s selections were based on high VST and high dividend Canadian stocks with high CI’s and good price to value ratios. Four of the five stocks met this criteria and one (FTN) was selected for its extremely high yield. Bill’s picks were MFC, TD, SMU.U, VIP.U, FTN.
Bob L’s picks: Bob chose a US stock portfolio based on a combination of specific country emerging market stocks and highly rated US growth stocks. According to Bob’s e-mail message these selections were done using a combination of “VectorVest readings, a gut feeling, hope and prayer”. Bob’s selections were AAPL, FB, EGPT, SMIN, and FM.
Gerry B’s picks: Gerry chose Canadian stocks using a ProTrader “MACD Crossover-Long” search. His selections, cherry picked from the twelve stocks returned by this search, were ACQ, TFI, TRI, BPY.U, and ELD.
Darren H’s picks: Darren chose five Canadian stocks using the stock viewer and selecting stocks that had very high value relative to their current stock price. Darren’s picks were AGT, EH, MAL, RE, and BIR. Darren confirmed his selections by looking at the stock graphs for each potential selection and confirming that each stock showed a steady incline in price from bottom left to top right. There was one exception where Darren overrode an unappealing graph pattern for a stock that showed a very high value relative to its current price.
Karyle B’s picks: Karyle chose US stocks using a bottom fishing strategy that was based on a retirement strategy called VST plus YSG Bottom Fishers. Karyle’s picks were EOG, HP, CNQ, XEC, and RGLD. These are all dividend paying stocks in companies with solid fundamentals that have been beaten down in the recent market downtrend as indicated by their low RT’s.
Irwin B’s picks: Irwin chose a Canadian stock strategy based on an aggressive bottom fishing strategy, Jailbreak/Ca. Irwin’s picks were AVO, LEG, LTS, SSO, and DGC.
Ron R’s picks: Ron R. chose a US stock strategy that was based on selecting the top five VST stocks on the stock viewer as of October 4, 2014. Ron R’s picks were IG, VDSI, GILD, FNHC and CALM
Allan K’s picks: Allan selected Canadian stocks using criteria that included current stock prices substantially below their value, a high RT (with one exception for CF) and a positive stochastics indicator (K above D and above 20). Allan picks were ATD.B, CNR, GC, FRX, and CF.
The chart highlighting contest results to November 22nd follows:
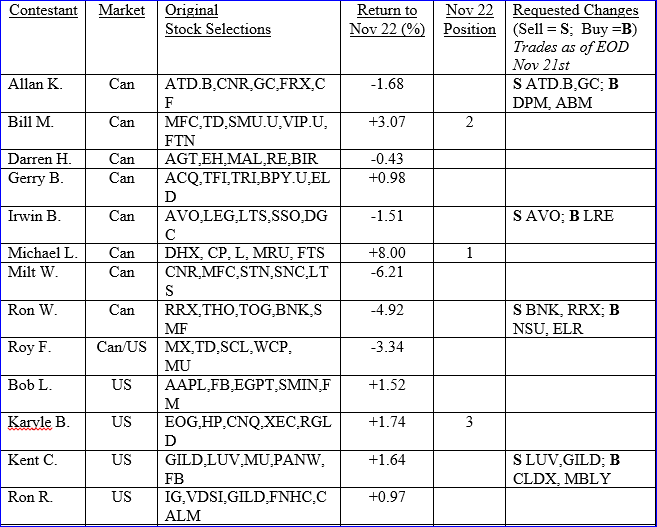
In reviewing the contest results to date the group members were in consensus that the timing of the contest start period, when the market was still in a confirmed downtrend, led to substantial initial losses that could have been avoided by proper observance of the VV market timing signals. A number of group members also commented on the importance of setting stop losses to avoid some of the huge losses that impacted some of the individual stock selections. The portfolios that appear to be at the front of the pack at present were those who chose more conservative, dividend paying stocks.
The group viewed the stock graphs for a number of the portfolio stocks and used the opportunity to look at the patterns between the stock price and stock value, walk through the process of setting up channel lines on a graph to indicate if a stock is breaking out up or down, and look at a similar technique using Bollinger Bands and the “Star Search”.
A number of participants requested that one or two of their current positions be sold with new selections picked to replace them (noted in chart above). Most used the same strategy to select the replacements as what was used to make the original selections. All requested “stock switch” transactions for the requests made prior to the November 22nd contest deadline will be made using the November 21st end of day prices for the securities.
Other Business
The group facilitator mentioned the new VectorVest Canada blog and showed the group the site. He recommended that the group check out the site as it has excellent information and videos prepared by Stan Heller and some very insightful strategies posted by some of the top Canadian VectorVest users, such as the creators of Petra’s Flyers and Jake’s Patent Winners contest winning searches. The link to the blog site is https://vectorvestca.azurewebsites.net/cablog .
The meeting ended with a confirmation of the date for our next VV user group meeting as December 13, 2014. The meeting location (2201 11th Avenue, Regina, SK) will remain unchanged.
submitted by Irwin and Karyle Blank

Hi would you mind stating which blog platform you’re using?
I’m planning to start my own blog in the near future but I’m having a difficult time deciding between BlogEngine/Wordpress/B2evolution and Drupal.
The reason I ask is because your design seems different then most blogs and I’m looking for something completely unique.
P.S Apologies for getting off-topic but I had to ask!
Hi Rick. The Blog is set up using WordPress. I don’t know all the ins and outs of it, but once the layout is established, it’s relatively easy to maintain.