Petra Hess, our Burlington, Ontario User Group Leader, is known to VectorVest subscribers for introducing and popularizing the 3/8-EMA crossover trading system. As guest presenter during Saturday’s International Online Forum, Petra showed she knows a lot about other charting indicators and how and when to use them.
“I’m all for helping people simplify their trading system,” Petra said. She is emphatic that investors need rules and they need to follow a systematic approach to investing. Simple, easy to follow rules are what makes the 3/8 trading system so effective. She says it’s no different with technical indictors.
“A lot of times,” she says, “investors don’t realize that they’re using indicators that actually measure the same thing”. We can unclutter our graphs and achieve better results when we understand the purpose of the various indicators and use them selectively.
Petra says VectorVest has enough technical indicators for everything we want to do on our charts, and 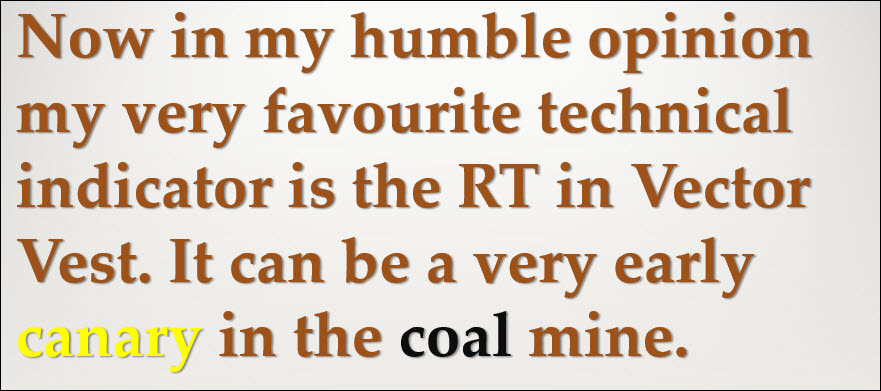 she explained the purpose of each one, from ADX and ATR, to DPO, MACD, Momentum, On Balance Volume, Stochastics and RSI. She revealed that her “very favourite” technical indicator is VectorVest’s exclusive RT or Relative Timing. She showed us how to use them all, and how to identify bullish and bearish divergences for trading opportunities.
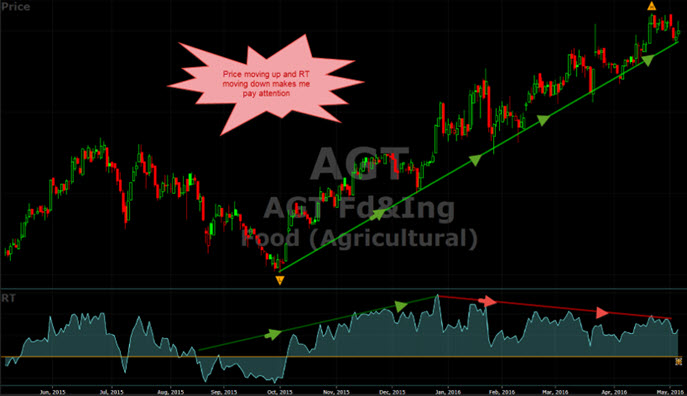
Petra stated that all the above indicators can be useful to help determine where price has been, where it is right now and where it is likely to go, but the bottom line is that price action itself overrules anything that a technical indicator does for us. For example she said, a lot of investors will look at a stock they own that is falling and they may take comfort in a technical indicator that shows it is likely to turn around, but it doesn’t always work out that way. That’s why she says, “If possible, base final decisions on price action.”
View the Recording. Best thing you can do is view the recording. “Time well spent”, said one attendee. “Petra’s presentation addressed all of my issues and confusion about using technical indicators”, said another. Just click on the link, and view the recording.
Petra’s 3/8-EMA is very complimentary to Dr. Barbara Star’s favourite charting method that we learned about in our April 2 Online Forum. For those who missed it, here again is the link to the Saturday, April 2 Online Forum including Dr. Star’s presentation.
Follow-up to Thursday’s Blog article and question: Which one or two indicators work best for our investment style? Below are the responses I received.
Gleason G. says: daily charts with 5 & 8 SMA on price confirmed with RSI rising above 60 and selling when RSI falls below 40
Mike S. says: I add value and EPS to Petra’s chart and I check the chart each night so if the is something unusual then I can get out and keep any losses manageable. First quarter this year up 17% + dividends. Thx Petra and Vector Vest:)
Leslie J. says: I use the Star Search with DPO (9/20) to filter my chosen accounts and use the Hess curves the night before to confirm a buy or a watch list entry.
Neil P. says: I am also having success with Petra’s 3/8 EMA crossover with Top VST stocks since the last confirmed up. Love the simplicity of the 3/8 that I have started using with all of my portfolios. Thank you so much Petra.
Margaret B. says: Thank You goes out to Petra Hess for sharing the 3 and 8 EMA Price Cross Over in her presentation in the fall of 2015. Starting January 4, 2016, I incorporated a 3 and 8 EMA Price Cross Over into my daily charts. I only purchased Canadian stocks with high VST and Timing, staying away from the US market because of exchange volatility….. Today was a milestone: this morning, April 27, 2016, just after the bell opened, I was up 100.60% in my Margin account in 4 Months! My RRSP account did very well also at 28.73%. I have never felt so relaxed and trading has never been so easy! Thank You VectorVest, you have made a tremendous difference in my life and in my future!
Replay of Previous Online Forums. Click on the links below to review any of our previous Forums:
May 7 – Special Presentation: Why More is Not Better When Using Technical Indicators by Petra Hess.


I finally got a chance this afternoon to view Saturday’s forum and it was fantastic – Petra did a great job with her presentation and I have gained new insights and will be a better trader for it – so thank you Stan and Petra for all your hard work on making this webinar so interesting, fun and educational.
Dear Stan,
I think you are taking the spirit of sharing to new highs.
Contributions from the various presenters is outstanding.
We in Australia can benefit from your ca blog since we are another resource country.
Thank you so much for our comments Edward. It’s our VectorVest members that make our Blog and our Online Forum such a tremendous success.
Thank you Stan for putting together this International Online Form with Petra Hess and for directing me to Dr. Barbara Star’s presentation. I really appreciate your help in helping us demystify the use of all these technical indicators with these forums and pointing me in the right direction with with these fine caring presenters that want to share their knowledge. Thank you so much. Dennis K.
Hi Dennis, Thank you for your kind comments about the monthly Forums. We have an amazing wealth of expertise in our VectorVest community. It’s great that so many are willing to share. Wishing you safe investing.
Hi Stan,
As we know If someone started trading hundreds and thousands of dollars worth of stock every day, then he should consider investing in Vector Vest. B’coz Vector Vest is the Best Financial Portfolio Management Software In 2015 & 2016 So far.
Thank you for those kind words Greg. The software is amazing and backed up by truly outstanding and ongoing education. Thanks again.