
by Leslie N. Masonson, MBA
Insight Enterprises, Inc. (NSIT:Nasdaq), headquartered in Chandler, AZ, and founded in 1988 boasts a 13,500 person workforce. Positioned as a Fortune 500 global technology company, its core mission revolves around leveraging technology to expedite digital solutions for business challenges. The organization concentrates on three primary sectors: cloud and data center management, digital innovation, and connected workforce.
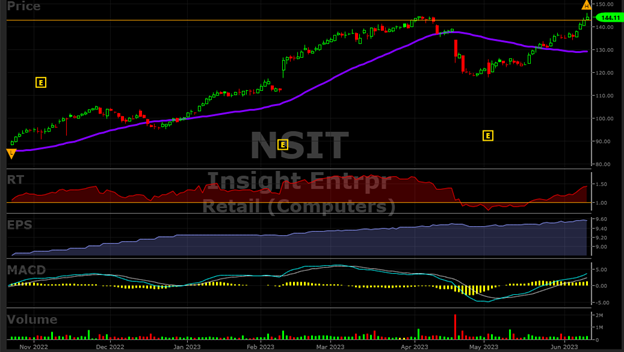
This past Friday, the stock managed to surpass its previous all-time high of $144.54 on April 4, 2023, reaching an intra-day peak of $146.03, before settling at $143.47 by the end of trading (refer to the accompanying chart). Notably, its performance in 2023 has yielded a remarkable 45.2% increase, gradually recovering from a rounded bottom pattern over the last three months. Surprisingly, however, the stock has not witnessed a surge in trading volume over the past two weeks, despite its 7% advancement. Consequently, it seems that significant accumulation of this stock has yet to materialize.
This lack of accumulation could be attributed to the company’s lackluster quarterly earnings, which concluded on March 31, 2023, with a negative 3.26% showing compared to consensus estimates. In the previous quarter, the company managed to surpass consensus estimates. On a positive note, the gross profit demonstrated a modest 3% increase, while earnings from operations skyrocketed by an impressive 50% year-over-year. In contrast, consolidated net quarterly sales experienced a discouraging 12% decline. Overall, the earnings report failed to make a strong impression on new investors, potentially serving as a hindrance to the expansion of daily share volume.
Nonetheless, the company’s value might experience an upswing following the June 8 announcement of a new service known as Insight Lens for GenAI. This addition augments their existing range of enterprise products, information platforms, as well as technical and infrastructure architecture. Furthermore, Insight Enterprises, Inc. has established itself as a leading figure in data and artificial intelligence (AI), as affirmed by Matt Jackson, Insight Global CTO. This recognition of their AI prowess bolsters the company’s reputation and competence in the field.
The area of artificial intelligence is currently experiencing a fervent surge, with both AI stocks and applications gaining considerable attention. Notable examples include OpenAI’s ChatGPT, Google’s Bard, and Amazon’s Bing Chart, among others. The soaring price action of tech stocks like NVIDIA, as well as the popularity of AI-focused exchange-traded funds (ETFs), bear witness to the market’s enthusiasm for this sector. Meanwhile, the majority of market participants are not participating in this narrow rally.
NSIT Has High VectorVest Scores, is Undervalued, and an AI Participant – A Triple Play Winner
How did this stock catch my attention among the 9,128 tracked by VectorVest? The process was rather straightforward. I accessed StockViewer, and there it was, ranked an impressive 21st based on its VST (Value, Safety, and Timing) score. Considering my initial lack of awareness regarding this particular company, its high ranking served as an impetus to delve deeper.
Upon further investigation, I discovered that NSIT occupied the coveted first rank among six stocks within the Retail Computer industry grouping. Even more striking was its top position among 244 stocks within the Retail Sector stock category, as designated by VectorVest. StockViewer arranges stocks from best to worst, enabling subscribers to identify hidden gems worthy of further scrutiny. It is conceivable that NSIT represents one of those hidden opportunities worth exploring.
VectorVest’s s key metrics for NSIT are as follows:
- Excellent Upside Potential: The Relative Value (RV) rating focuses on a stock’s long-term, three-year price appreciation potential. The current RV rating for NSIT is 1.46 which is well above average on a scale of 0.00-2.00. The current stock price is $145.33, while VectorVest pegs its value at $190.18.
- Good Safety: The Relative Safety (RS) rating is based on the company’s business longevity, financial predictability/consistency, debt-to-equity ratio, and additional risk parameters, including price volatility. Its RS rating of 1.39 is above average, indicating slightly above-average risk.
- Excellent Timing: The Relative Timing (RT) rating focuses on the price trend over the short, medium, and long term. The components include price direction, dynamics, and price magnitude of price changes over daily, weekly, quarterly, and yearly comparisons. NSIT has an exceedingly high RT rating of 1.41 compared to the average 0.98 RT of all the stocks in the database which means that the stock has been much better than average over multiple timeframes, but in this case over the past six days.
- Excellent Comfort Index: This index measures the consistency of a stock’s long-term resistance to severe and lengthy corrections. This index compares the individual stock to the fluctuation of the VectorVest Composite price that is measured on a scale of 0 to 2.00. At a level of 1.33, NSIT’s rating is significantly above average. Therefore, this stock can be considered by both conservative and aggressive investors.
- Excellent Growth Rate (GRT): NSIT’s 19% forecasted growth rate is measured over a forecasted three-year period. This fundamental factor is calculated in the VectorVest software, so you don’t have to do the work. The chart below highlights the near-term positive earnings trend over time, which has been improving recently.
- Excellent VST Score: The VST Master Indicator ranks 9,128 stocks from high to low and brings stocks with the highest VST scores to the top of the list. NSIT’s VST is 1.42 which is considered a high score. Using VST enables users to identify stocks that are performing much better than average, as well as those performing much worse than average. Clearly, NSIT falls in the former category, and why it is currently rated a “BUY”.
With its impressive metric ratings, this stock undoubtedly belongs to the “cream of the crop” in their investment universe, making it a potential addition to most investors’ watchlists. Following its notable 27% price surge over the past seven weeks, potential buyers might want to exercise caution and wait for a pullback before considering a purchase. It’s worth noting, however, that the stock’s ascent has been steady and gradual, rather than an abrupt parabolic move. This gradual progression suggests that the stock may continue along this trajectory in the foreseeable future. As a result, investors should leverage technical tools to determine a suitable buy point that aligns with their risk tolerance before committing any capital.
Before diving into purchasing shares, it is crucial to ensure that several conditions are met. Firstly, the stock price should remain above the $144 threshold. Additionally, the MACD (Moving Average Convergence Divergence) indicator should retain a positive reading, indicating positive momentum in the stock. Moreover, the daily trading volume should reach a minimum of 340,000 shares, ensuring adequate liquidity. The RT (Relative Timing) indicator should remain above 1.00, further affirming the stock’s strength. Lastly, investors should pay attention to the overall VectorVest “Confirmed Calls” timing signal, which turned “bullish” on June 8, suggesting a favorable outlook for the market in general.


Want These Types of Insights at Your Fingertips so You Can Win More Trades?
Use VectorVest to Analyze any stock free. VectorVest is the only stock analysis tool and portfolio management system that analyzes, ranks and graphs over 18,000 stocks each day for value, safety, and timing and gives a clear buy, sell or hold rating on every stock, every day.
Before you invest, check VectorVest! Click here to ANALYZE ANY STOCK FREE and see our system in action!


Leave A Comment