There was an abundance of valuable tips and strategies presented to a near capacity audience attending Saturday’s International Online Forum. And great news: The replay is now available. Click Here to View.
So many you chatted in your thanks and positive comments which we greatly appreciate. Below is just a small, representative sample:
David W. – “Tom and Petra – GREAT STUFF”!
Val F. – “Both great presentations! Love the International Forum. Thank you Stan, Tom and Petra.”
Floyd F. – “Awesome Forum.”
Tom C. – “Fantastic presentations.”
Tom Mitchell, a member of our Nanaimo, BC User Group and a retiree, presented the step-by-step process he used to  develop a trading plan that suits his conservative to prudent investment style. His priorities are safety and income. He explained how he used Quicktests followed by a series of Backtests to come up with a search and trading plan that delivered consistently positive results with a low drawdown.
Suited for his investment goals, Tom’s search used a Relative Safety (RS) sort and a high Comfort Index (CI) rating of 1.2 or better. VST and RT must be greater than 1.0, Avg Vol > 50,000 and no mining stocks (“too volatile”). His income requirement is satisfied with a Dividend Yield (DY) > 1.5%. After achieving the results shown with a beautiful bottom left to top right equity curve, he is now ready to paper trade to build even more confidence in the plan and then implement.
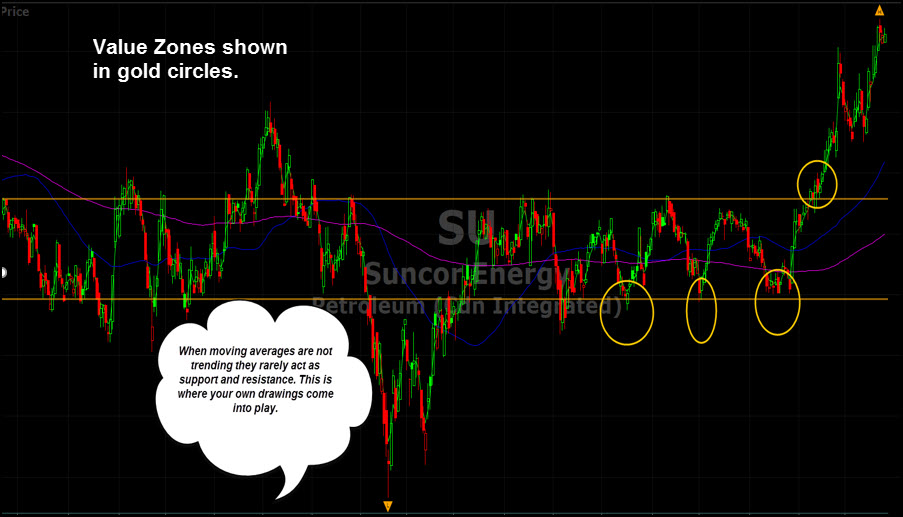
Petra Hess, leader of our Burlington, ON User Group, spoke about Value Zone Investing, giving investors valuable tips, techniques and strategies to make more money by being patient, and “negotiating” absolute best entries and exits. While Petra is known for introducing and popularizing the fabulous 3/8-EMA trading system at previous Forums, Saturday she broadened our knowledge of investor psychology and charting.
What are Value Zones? Petra describes them as areas of support when we are going long and resistance when we are going short. “These can be major moving averages, support and resistance lines whether horizontal or diagonal, and Fibonacci retracements.” Watch the reply to see plenty of examples.
Petra explained how she previously ‘did okay’ buying top stocks from searches, but she found too often that approach led to “chasing” stocks near the top of an uptrend. Learning and understanding the best time and setups to buy was the genesis of her Value Zone Investing techniques and strategies. She said she has learned to stalk stocks. “Being patient is the most important thing.”
Now she says, “I spend my time planning my trades and looking for high probability setups. I’ve learned that it is wise to forego mediocre trades. Instead I direct my efforts and my capital toward higher probability setups, those that offer a low risk, high reward opportunity.”
When it comes down to getting more precision entries on an up-trending stock that is pulling back, Petra said she’s found the common denominator comes down to asking a simple but important question, “Is it done falling?” She will monitor price action and watch for evidence the stock is done falling by way of candlesticks, patterns and support for example. That’s the Value Zone.
“I look for a solid point where there could be a reversal, and not just guess where the reversal is going to be.” In just one example of several Petra showed us in the Forum, Petra said she loves buying and selling stocks that are in a trading range. At the bottom of the range or channel is the support area which Petra calls the Value Zone.
 How to Trade Like A Pro. During Friday’s Special Presentation SOTW, Senior Instructor Jerry D’Ambrosio demonstrated a popular RSI (Relative Strength Index) trading system created by professional trader Larry Connors. Please join me Tuesday, March 7 at 12:30 Eastern / 09:30 Pacific for our free weekly SOTW Q&A webinar. We’ll answer your questions, study the markets in RealTime, and most important, together we’ll look for stocks that meet Connors RSI pattern setup. Here is the link to register: Register Now for Tuesday’s Q&A.
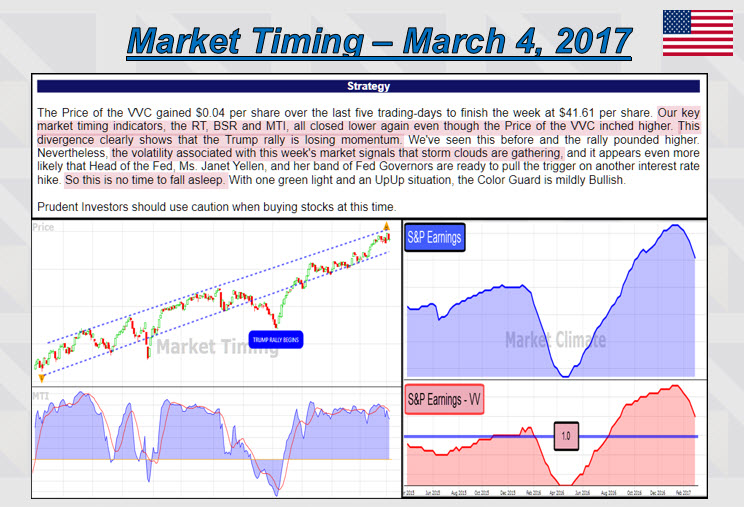
The Market Forecast. In my review of the Canada and U.S. markets for the Forum, I pointed out that VectorVest Views identified bearish divergences in both markets. Price of the overall market, the VectorVest Composite, rose last week but our key market timing indicators, the RT, BSR and MTI, all closed lower. As Dr. DiLiddo wrote, “This divergence clearly shows that the Trump rally is losing momentum, We’ve seen this before and the rally pounded higher. Nevertheless, the volatility associated with this week’s market signals that storm clouds are gathering……So this is no time to fall asleep.” Another factor to consider, although not a market timing signal, VectorVest’s Earning Trend Indicator is falling and is now hovering around 1.0 as shown in the graphs below. If it falls below 1.0, and interest and inflation continue to rise, the market climate will change from a Case 4 Bull Market to a Case 5 Bear Market, the beginning of a new Bear market.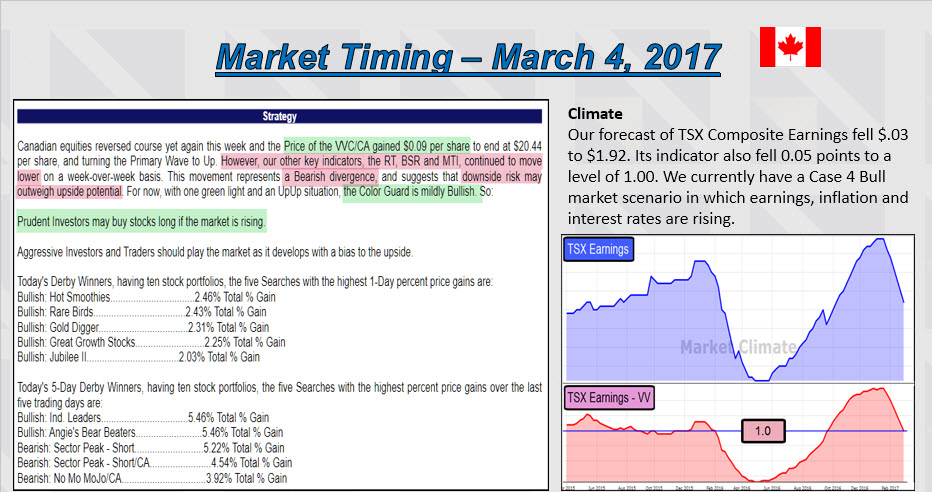
Not a VectorVest Subscriber? Take a 5-Week Trial for just $9.95 USD. Check out VectorVest’s analysis of the stocks you own and view the Successful Investing 5-part Video Series before you decide if VectorVest is right for you. Call 1-888-658-7638 to arrange your trial.
To View previous Online Forum video replays, click on the recording links below:
January 7, 2017 – Stock Chat hosted by Stan Heller, Consultant VectorVest Canada
December 3 – My Three Friends: Value, Price and Earnings by Mike Simonato, Ontario VV Member.
November 5 – Guide to Worry-free Investing with Dr. Bart DiLiddo
Posted by Stan Heller, Consultant, VectorVest Canada
DISCLAIMER: The information contained in this Blog is for education and information purposes only. Example trades must not be considered as recommendations. You should always do your own analysis and invest based on your own risk tolerance, investment style, goals and time horizon. There are risks involved in investing and only you know your financial situation, risk tolerance, financial goals and time horizon.


Leave A Comment