Thanks everyone for your positive comments about the multiple moving average graph layout we demonstrated during the VectorVest International Online User Group Forum Saturday, August 10.
One member chatted in, “Your presentation today was one of the most exciting I have seen so far.”
Another said, “I find the graph layout an easy picture to follow. I find it an easy picture to follow and I will be looking at this picture for confirmation and assistance in making trading decisions.”
The video link is copied below.
https://attendee.gotowebinar.com/recording/7399078137969809411
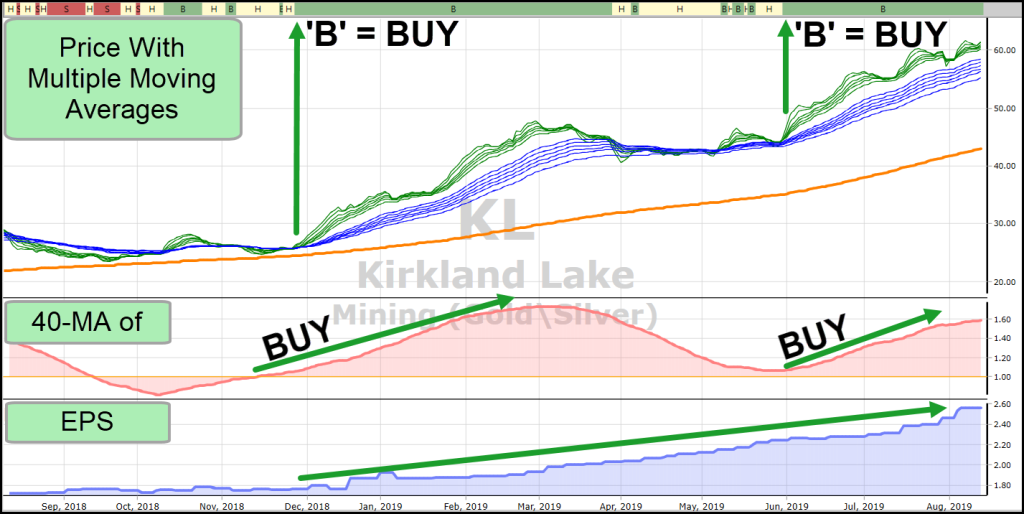
Several people let me know they have already set up their graphs and are having a blast studying stock after stock. They like what they see with the multiple moving average set-up together with VectorVest’s exclusive 40-day moving average of Relative Timing, RT and forecasted EPS providing clear and concise information.
The recording takes you step-by-step through the process of setting up and saving this new graph layout. We put out a challenge Saturday for everyone to study at least 300 graphs using the layout.
Pro TIP: If you are a conservative investor who is seeking a high win-rate, purchase only BUY-rated stocks, only when the market is rising, EPS is rising and the 40-MA of RT is above 1.0 and rising, as shown below.


Leave A Comment