
THE NEW TSX 30 WATCHLIST
Written by: Stan Heller
The TSX 30 is an annual list of the top-performing stocks on the TSX over three years, based on dividend-adjusted share price performance. With 15 oil & gas stocks on the list, this year’s edition shows how dominant the Petroleum Sector was through most of 2021 and 2022. Remember, this resurgence arrived on the heels of a steep 2-year decline.
The outsized gains were thanks to surging global energy demand and high commodity prices. Eight mining stocks also made the TSX 30 list.
The Petroleum stocks’ dominance on the TSX 30 list will not surprise VectorVest subscribers. The Sector was frequently near or at the top of the Sector Viewer during this period. It was hard not to notice the top 20 VST stocks in the Stock Viewer were frequently comprised entirely of Petroleum stocks.
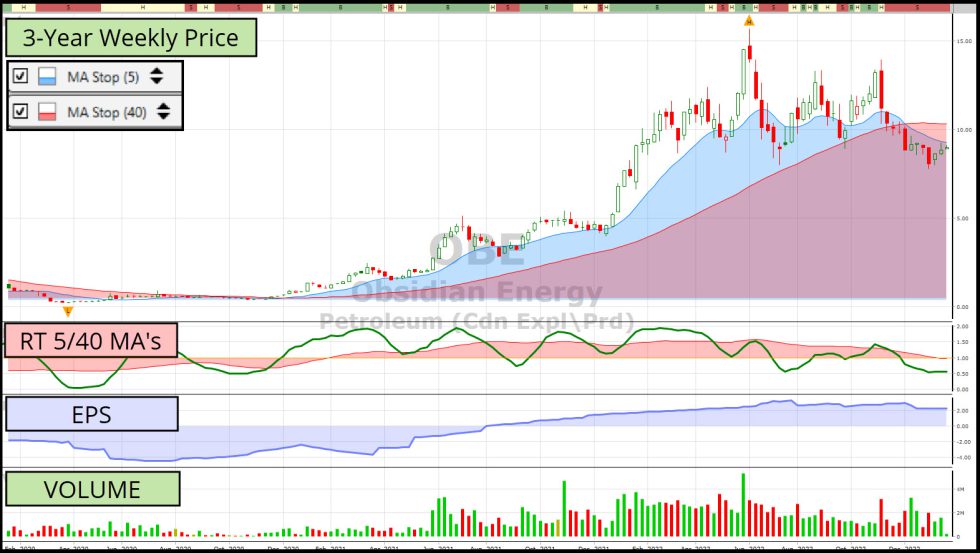
Per an article from the TMX Money, gold and base metal miner Aura Minerals (ORA) had the top 3-year performance with a gain of 683%. Obsidian Energy Ltd (OBE), formerly Penn West Petroleum Ltd, led the energy group after its dividend-adjusted share price rocketed 537% since 2019. Obsidian is a mid-size oil and gas company focused on light oil in central Alberta.
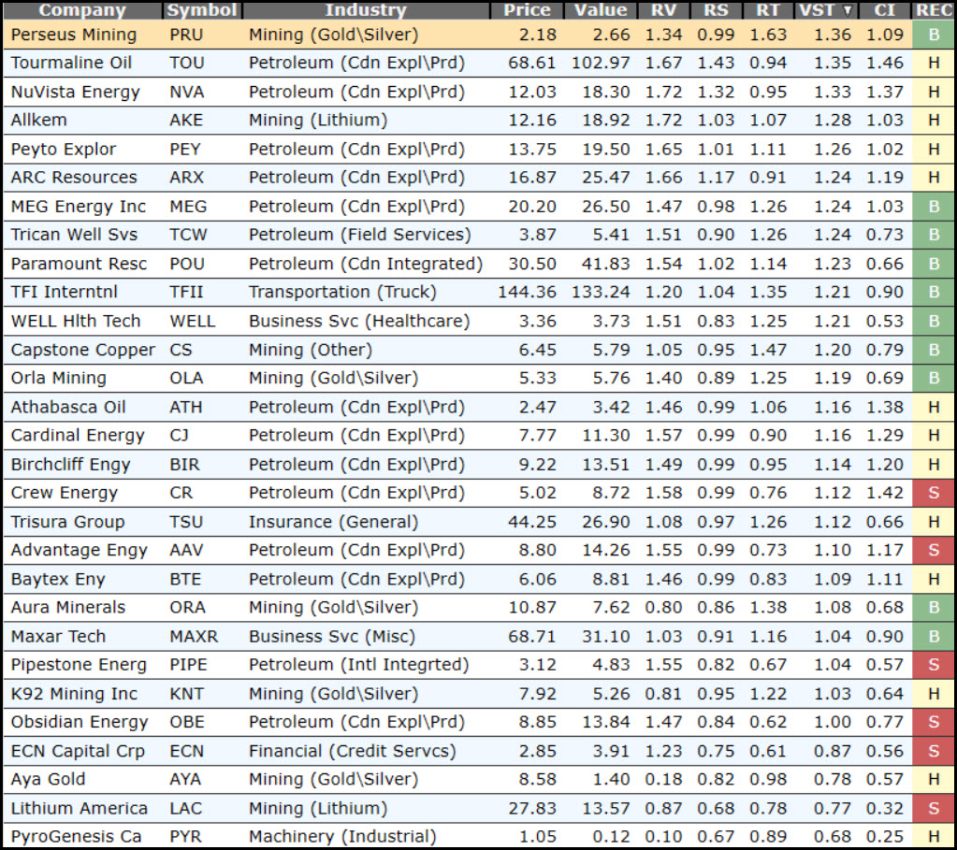
Copied below is the complete TSX 30 list as of January 20th. You will find the list in the WatchList Viewer’s TSX group. Notice there are just 29 stocks listed this year. That’s because IBI Group (TSX: IBG) was recently acquired by Arcadis and is no longer listed on the TSX.
GRAPH’ EM DANNO. A helpful exercise is to go to the TSX 30 WatchList and select Graph ALL. I set my timeframe to a 3-year Weekly graph as shown above on OBE. I used the NPI Near Perfect Indicator Layout from the Graph Layouts menu.
Notice OBE received a new Buy signal on 12/29/20. At the same time, the STOP 5-MA had just crossed above the 40-MA. The closing Price was $0.87. The RT 5-MA had crossed above the RT 40-MA earlier on 11/23/20 when Price was just $0.56. Either entry was excellent but notice how the STOP 5-MA stayed above the STOP 40-MA right up until 12/12/22. The closing Price was now $9.15. There were clear signs where an investor could have sold earlier and locked in more of the gain. Where would you have gotten out?
As you go through the graphs, you should notice, as I did, that identifying the start of a trend using a disciplined setup and then trading in the direction of the trend led to substantial gains.
Graphing the list is a simple exercise and doesn’t take much time. There is a lot you can learn from THE NEW TSX 30 WatchList.
Please CLICK HERE to read more on the TMX Money Article.


Leave A Comment