by Leslie N. Masonson, MBA
ATI Inc., a NYSE-listed firm (ATI), is headquartered in Dallas and has a rich history dating back to its establishment in 1996. With a workforce of 6,700 employees, this company, previously known as Allegheny Technologies, has established itself as a global leader in the production of integrated specialty materials and components across a range of industries. These encompass electronics, aerospace and defense, medical, and specialty energy sectors.
One of ATI’s notable strengths lies in its ability to transform materials like titanium, nickel, and cobalt into various shapes and sizes, catering to the diverse needs of its clientele. Demonstrating its skill in securing significant contracts, the firm announced in late June a sizable $1.2 billion sales agreement with several aerospace and defense companies.
Furthermore, ATI experienced a change in its leadership team during the early days of June. The appointment of Kimberly Fields, previously serving as the executive vice president and Chief Operating Officer, as the new COO and President brought a fresh perspective to the position. It appears that these recent developments have had a positive impact on the stock price, which has spurted higher since June.
How did I come across ATI Inc? I pulled up the VectorVest Industry Viewer—an invaluable resource that ranks the 222-industry grouping. This viewer ranks all the industries on a daily basis. Steel (Alloy) emerged as the #1 ranked one, not only on July 7 but also on June 30. However, it is worth noting that this industry was ranked eighth as recently as June 2. Thus, within a span of a month, it has managed to run up to near its 2014 all-time high.
Next, I reviewed the individual stocks within the Alloy industry. ATI secured the second ranked position out of a total of five stocks. I then reviewed its VectorVest metrics associated which turned out to be exceptional. That is why I wanted to bring ATI to your attention, as I believe it should be placed on your watchlist.
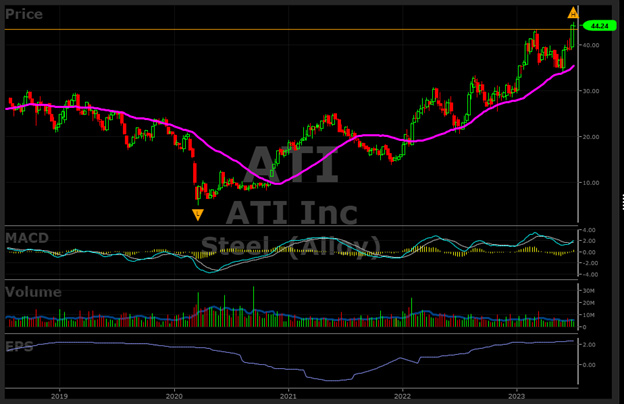
ATI ended June on a high note, with its stock price reaching its highest point in nine years. This achievement indicates that there is minimal resistance in terms of overhead price, with only a marginal gap of slightly over $2 remaining to surpass the 2014 price high of $46.88. As of the July 7 closing, ATI’s stock settled at $44.24, reinforcing its positive momentum.
Within the steel sector, VectorVest tracks only two industry categories — Alloys and Basic steel. The latter’s ranking is 110th position out of the 222 industry groupings monitored. This observation underscores an important point: within broad sectors encompassing multiple industries, there will inevitably exist both front-runners and laggards. Recognizing this crucial distinction empowers investors to concentrate their efforts on the former, maximizing their chances of success. In this context, VectorVest emerges as a valuable tool, enabling individuals to identify and pinpoint both the leaders and laggards within various sectors. Armed with this information, investors can focus their attention and resources on the industries that exhibit strong potential for growth and profitability.
Presently, ATI Inc. enjoys significant institutional support. A total of 408 institutions have shown confidence in the company’s prospects, collectively holding a 107% of the outstanding shares. Notably, Blackrock stands out as the largest institutional holder, with an impressive stake of 15.8%. The Vanguard Group follows closely behind with 11.3%, while Capital International Investors secure a significant 10.4% ownership of the company’s shares. It is quite unsettling, though, that insiders themselves only possess a modest 0.68% stake in the company.
ATI Has High VectorVest Scores, But Only Fair Safety, So It May Be Better Suited for Higher Risk Investors
VectorVest’s excellent metrics for ATI are as follows:
- Excellent Upside Potential: The Relative Value (RV) rating focuses on a stock’s long-term, three-year price appreciation potential. The current RV rating for ATI is 1.50 which is well above average on a scale of 0.00-2.00. The current stock price is $44.24, while VectorVest pegs its value at $52.95, so it definitely has room to run to multiple all-time highs.
- Fair Safety: The Relative Safety (RS) rating is based on the company’s business longevity, financial predictability/consistency, debt-to-equity ratio, and additional risk parameters, including price volatility. Its RS rating of 0.90 is slightly below average, indicating above-average risk, so conservative investors may want to do additional research and check the other metrics here to obtain an overall picture of the company’s future prospects.
- Excellent Timing: The Relative Timing (RT) rating focuses on the price trend over the short, medium, and long term. The components include price direction, dynamics, and price magnitude of price changes over daily, weekly, quarterly, and yearly comparisons. ATI has a well above average RT rating of 1.50 compared to the average of 0.97 for all the stocks in the database which means that the stock has been a better performer over multiple timeframes than the majority of stocks.
- Excellent Comfort Index: This index measures the consistency of a stock’s long-term resistance to severe and lengthy corrections. This index compares the individual stock to the fluctuation of the VectorVest Composite price that is measured on a scale of 0 to 2.00. At a level of 1.64, ATI’s rating is extremely high. Therefore, this stock is well suited for conservative investors based on this metric.
- Excellent Growth Rate (GRT): ATI’s 38% forecasted growth rate is measured over a forecasted three-year period. This fundamental factor is calculated in the VectorVest software, so you don’t have to do the work. The chart below highlights the multi-year positive earnings trend which has been rising since mid-2021, after a period of falling earnings.
- Very Good VST Score: The VST Master Indicator ranks 9,124 stocks from high to low and brings stocks with the highest VST scores to the top of the list. ATI’s VST is 1.33 which is considered high. Using VST enables subscribers to identify stocks that are performing much better than average, and ATI falls in that category.
Upon examining the good-looking chart below, we observe that since its low point on November 30, 2021, the stock has encountered a few bumps along the way. These occurred in June 2022, October 2022, and once again on May 31, 2023. Such a choppy chart pattern may pose a challenge for conservative investors who prefer stability. However, for the more aggressive investors, these bumps would likely be viewed as opportunities to ride the stock’s upward momentum while employing flexible stop-loss measures.
In particular, during the period from March to early June 2023, the stock exhibited a trading range with a slight downward bias. However, a significant turning point came with its open gap on June 2, propelling the stock from $34.50 to nearly $45—a remarkable 28.6% surge in just over a month. Comparatively, this performance far outshines the S&P 500’s modest 6.1% advance during the same period.
Furthermore, several indicators show ATI’s positive trajectory. The Moving Average Convergence Divergence (MACD) indicator reflects a favorable trend, while earnings exhibit a positive upward trajectory. Notably, the volume of trades has exceeded average levels over the past two weeks, with an average daily volume surpassing one million shares. A stock exhibiting such strong momentum deserves close monitoring and should be considered for purchase upon breaking out to new highs (above $46.88 in ATI’s case) or after a suitable pullback, depending on which scenario unfolds first.
Undoubtedly, ATI has emerged as one of the market’s top performers since early June, sporting a recent “BUY” rating from VectorVest. Therefore, it is prudent to actively track this stock for potential investment opportunities. Additionally, it is crucial to ensure that VectorVest’s “Confirmed Calls” signal also remains on its recent “BUY” signal. Regrettably, as of July 6, the “Confirmed Calls” signal has transitioned to a “Sell”. Hence, it pays to subscribe to VectorVest to have access to the next “BUY” signal, which will pinpoint a good entry point. Investing in a declining market without a sound strategy can prove costly, underscoring the importance of relying on a dependable trading approach supported by software that has provided a long track record of accurate calls.
Want These Types of Insights at Your Fingertips so You Can Win More Trades?
Use VectorVest to Analyze any stock free. VectorVest is the only stock analysis tool and portfolio management system that analyzes, ranks and graphs over 18,000 stocks each day for value, safety, and timing and gives a clear buy, sell or hold rating on every stock, every day.
Before you invest, check VectorVest! Click here to ANALYZE ANY STOCK FREE and see our system in action!


Leave A Comment