Construct and Analyze Your Option Positions

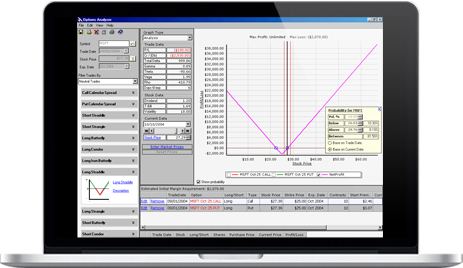
The VectorVest Options Analyzer has an intuitive, easy-to-use interface. Create a simple option position based on current stock information and option expiration date, construct your own composite option trades, or use one of the built-in trades. The Options Analyzer offers 10 different analysis graphs to show you how changing a stock’s price and time to expiration affects your option position. You can also use the Price Probability Analyzer to evaluate the theoretical probability of the stock’s price performance.

The VectorVest Options Analyzer accesses the VectorVest database and allows you to verify and examine the Profit/Loss implications at expiration of options trades. It also allows you to perform sensitivity studies of all the factors affecting the option premiums prior to expiration. It is perfect for back-testing ideas and for assessing potential option trades.
Available for a one-time fee of $495.
downloadFree 30-Day Trial
Options Analyzer Chart Types
  • Analysis – The Analysis Chart is a graphical representation of the potential outcomes of an option strategy.
  • Probability – Using the Probability Chart, you can see the theoretical probability of a stock’s price based on its price volatility and time to option expiration.
  • Time Decay – Using the Time Decay chart, you can view the option time decay based on time to expiration and stock price volatility.
  • Trade Simulation – The Trade Simulation Chart allows you to view the performance of actual option positions with the passage of time.
  • Volatility – The Volatility Chart allows you to view a graphical representation of the historical volatility of the security.
  • Delta, Gamma, Theta, Vega, and Rho – These charts allow you to view a graphical representation of the “Greeks” – the basic analyses of option pricing.
Let Our Sample Trades Show You the Way
You can maximize profits and minimize downside risk using options by constructing composite option trades. The Options Analyzer provides over 30 different sample trades that are used by the best option traders.

[accordion clicktoclose=”true” class=”sampleTrades”][accordion-item title=”View Our Sample Trades (+)”]

Bullish Trades
  • Long Stock
  • Long Call
  • Short Put
  • Covered Call
  • Fence
  • Bull Call Spread
  • Bull Put Spread
  • Put Ratio Spread
  • Call Ratio Back Spread
  • Bull Call Diagonal Spread
Neutral Trades
  • Call Calendar Spread
  • Put Calendar Spread
  • Short Straddle
  • Short Strangle
  • Long Butterfly
  • Long Condor
  • Long Iron Butterfly
  • Long Iron Condor
  • Long Straddle
  • Long Strangle
  • Short Butterfly
  • Short Condor
  • Short Iron Butterfly
  • Short Iron Condor
Bearish Trades
  • Short Stock
  • Short Call
  • Long Put
  • Married Put
  • Collar
  • Bear Call Spread
  • Bear Put Spread
  • Bear Put Diagonal Spread
  • Call Ratio Spread
  • Put Ratio Back Spread

[/accordion-item][/accordion]

What are Your Chances?

The Options Analyzer includes the Price Probability Analyzer. Based on historical price volatility, option expiration and current stock price, the Options Analyzer will calculate a theoretical probability that a stock’s price will be above, below, or between two variable price points that you define. Using the Price Probability Analyzer, you can determine whether or not the chances are good that you are going to make money, lose money, or break even on an option trade.